Civil Engineering Reference
In-Depth Information
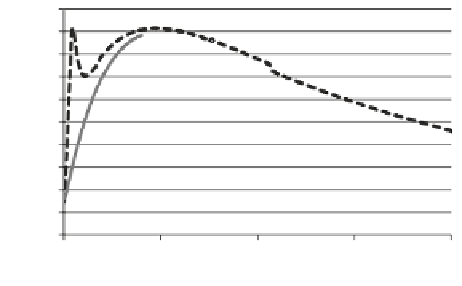
Fig. 5.8
Thermal profiles for
partial contact and sufficient
contact between the dies and
workpiece [
13
]. If there is not
sufficient contact between
the dies and the workpiece,
then sparking could occur
and generate steep spikes at
the beginning of the thermal
profile for that test
200
180
160
140
120
100
80
Partial Contact
Sufficient Contact
60
40
20
0
0
5
10
15
20
Time (s)
the air pockets and the resistance of the asperity peaks of both surfaces in contact.
Therefore, the real contact area depends on the surface finish of the dies and the
workpiece. During a stationary electrical test, there is no significant change in the
asperities aspect, while during the deformation process, the asperities are flattened
to some extent, and thus, the real contact area increases. The increase in contact
area results in a decrease of the resistance of the zone, thus a decrease in voltage
drop across the junction point. A more in-depth calculation of the real contact area
and its influence is a point of future research for this process.
The change in the real contact area can have an effect on the workpiece tempera-
ture profile throughout the EAF tests. Figure
5.8
displays representative temperature
profiles along the longitudinal axis of the workpiece at the beginning and toward the
end of an EAF test. Of note is that, at the beginning, where the real contact area is
lower, the die/workpiece interfaces will be hottest, since the electrical power dissipa-
tion will be greatest at these points. Conversely, the center portion of the workpiece
will be hottest at the end of the test, since the real contact area will be larger at the
interfaces than at the beginning, thus lowering the electrical power. Figure
5.8
helps
to illustrate this phenomenon. In this figure, there are two EAF tests: (1) a test with
sufficient contact (i.e., a large real contact area) and (2) a test with partial contact
(i.e., a small real contact area). The test with partial contact at a preload of about
670N shows a spike at the beginning of the test where the power at the die/work-
piece interfaces is extremely high until sufficient pressure is applied to the part. The
other thermal profile, where a much larger preload of about 1780N was used, did not
show this thermal spiking phenomenon at the start of the electricity application.
5.2.5 Experimental Setup and Procedure
The experimental objectives of this section are to: (1) compare and validate the
thermo-mechanical model via comparing experimental results to modeling results,
and (2) discuss the efficiency of the EAF tests performed in relation to applied elec-
trical power versus stress reductions. This is approached through design of experi-