Environmental Engineering Reference
In-Depth Information
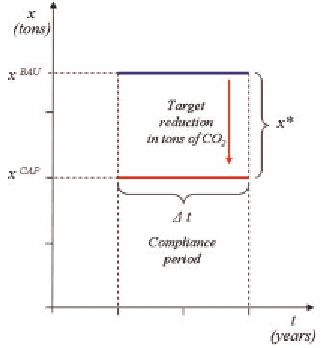
Figure 1. Derive target reduction for compliance
period
Figure 2. Derive price point for emission allow-
ances
in comparison to business as usual emissions. The
demand curve and slope depends on how costly it
is to reduce emissions to avoid having to purchase
allowances in the market.
In the following we illustrate the cap and trade
market mechanism as a transmission channel in
an emissions constraint economy. The reason to
focus on the impacts in the electricity sector is
twofold. First, for most economies the coal, gas
and oil fired power generation plants are the largest
commercial emitters and, hence, are most affected
by emissions constraints. Secondly, electricity is
a regional product where producers do compete
with other regional producers subject to the same
cap and trade regime but not with outside produc-
ers. Hence, electricity producers in a liberalized
electricity market should be able to pass on emis-
sions related costs to the wholesale and retail
consumer. This differs in other industry sectors,
where firms covered by the regime would have
to compete with others outside the regime.
14
We
make the assumption that the electricity market is
liberalized as it is more or less the case for most of
the large electricity markets in the EU. It follows
from this assumption that electricity prices should
reflect the short run marginal cost of generation
which will include the cost of consuming emis-
sion allowances.
15
Figures 1 to 3 illustrate the transmission chan-
nel in an emissions constraint economy from set-
ting a certain cap on overall emissions
x*
(Figure
1) to deriving a market based price point
p*
where
marginal revenues and marginal abatement cost
per ton of CO2 are balanced (Figure 2) to finally
arrive at an electricity price
p
E
where the carbon
uptick of
p*
times the specific efficiency factors
is added to each generation technology of an
economy's electricity generation fleet.
Figure 1 illustrates the equivalent of cumula-
tive emissions in a business as usual scenario
without emissions constraints denoted with
x
BAU
.
The cap
x
CAP
, i.e. the maximum amount of emis-
sion allowances allocated, is defined for a certain
compliance period
Δ t
. The target reduction
x*
results from the difference of
x
BAU
and
x
CAP
. The
target reduction
x*
determines the scarcity in the
emissions trading market and, hence, defines the
price point
p*
in Figure 2.
Since the aggregate marginal cost of abate-
ment in the economy is not observable as such,
the price point
p*
is the result of the individual
firms calculus to balance the marginal cost of