Environmental Engineering Reference
In-Depth Information
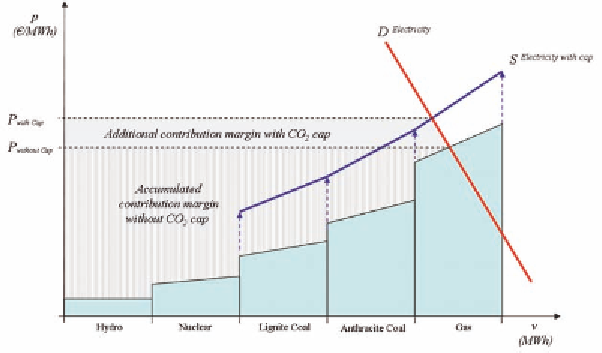
Figure 3. Derive price point for electricity with emissions uptick
abatement per ton of CO2 with the marginal
revenues per ton of CO2 emissions. The latter is,
in essence, the function of competitive emissions
trading markets. Figure 3 shows how the price
p*
drives the electricity price by shifting and twist-
ing the aggregate supply curve for electricity
S
to account for the opportunity costs of emission
allowances. The price for electricity then results
from the intersection of the electricity demand
curve
D
and the electricity supply curve
S
after
applying a cap.
In Figure 3 we consider a generation fleet
comprising five different technologies. The hy-
pothetical merit order before taking the emissions
uptick into account would essentially be reflective
of fuel costs. The extent to which thermal plant
generation costs increase depends on both the CO2
content of the fuel and the thermal efficiency of
the generation technology. For this stylized fleet of
generation plants, hydro and nuclear power plants
would be cheapest, followed by lignite coal fired
and anthracite coal fired power plants, and, finally,
gas fired power plants. However, after taking the
emissions uptick into account - i.e. adding the
price
p*
per ton of CO2 times the specific effi-
ciency factors for lignite coal, anthracite coal, and
gas - the slope of the original merit order twists
in favour of the more carbon efficient technolo-
gies. In our stylized example, gas and anthracite
coal become more attractive because lignite coal
combustion emits proportionately more CO
2
. In
summary, carbon efficiency drives the slope of
the supply curve for electricity in an emissions
constraint economy.
For example, a report from the German
government, which was prepared in the course
of benchmarking generation plants for the cur-
rent compliance period, reveals some figures
on relative efficiency of the different generation
technologies (BMU, 2007). The CO
2
consump-
tion coefficients used as benchmarks in Germany
are as follows: 365g CO
2
per KWh for gas fired
technology, 750g CO
2
for anthracite coal fired
technology, and 990g CO
2
per KWh for lignite
coal fired technology. Simply applying March
2010 price levels of German base load electricity
of ca. 36 € per MWh and the respective European
allowance price levels per ton of CO
2
ca. 13 € per
ton to these efficiency benchmarks, the emissions
uptick added to the base running costs for gas
fired technology would start in the range of 15%,
the uptick for anthracite coal technology at about
37%, and the uptick for lignite coal technology
at about 55%.
So far we have analysed the price effects on
competitive electricity markets in an emission