Biology Reference
In-Depth Information
41.3
C) and 29 mol%
[39]
. Monolayers were made from 70 mol% DPPC (16:0, 16:0 PC, T
m
¼
20
C) to which 1 mol% N-rhodamine-PE was added as the
membrane imaging agent. Compressions were run and images taken at every 5 mN/m.
At the experimental temperature, 23
C, DPPC is below its T
m
and so would be in the gel
(solid) state while SDPC is above its T
m
and would be in the liquid crystalline (fluid) state.
The N-rhodamine-PE fluorescent probe partitions preferentially into the fluid (SDPC)
phase. The images clearly show phase separation into liquid crystalline (fluorescent, white)
and gel (non-fluorescent, black) state domains that are affected by the lateral pressure.
In the late 1980s Haverstick and Glaser
[40,41]
investigated cation-induced phase separa-
tion of anionic phospholipids into domains. They employed a fluorescence microscope,
a CCD camera, and a digital imaging processor to visualize lipid microdomains on the
surface of very large (5
e
15
m
M) lipid vesicles. The fluorophore NBD (4-nitrobenzo-2-oxa-1,
3-diazole) was attached to the sn-2 chain of PA, PS, PE, and PC. Vesicles were made from
the bulk lipid DOPC (99 mol% of the total phospholipids) to which 1 mol% of the fluorescent
probe (NBD-PA, NBD-PS, NBD-PE or NBD-PC) was added. It was demonstrated that Ca
2
þ
,
but not Mg
2
þ
,Mn
2
þ
,orZn
2
þ
, induced phase separation of the anionic fluorescent phospho-
lipids NBD-PA and NBD-PS from DOPC (
Figure 11.10
,
[40]
). NBD-PE and NBD-PC did not
phase separate. The conclusion that Ca
2
þ
can induce formation of lipid microdomains
composed of fluorescent anionic phospholipids was confirmed in erythrocytes, erythrocyte
ghosts, and vesicles made from erythrocyte lipid extracts.
In a subsequent paper, Haverstick and Glaser extended their Ca
2
þ
work to include the
cationic peripheral protein cytochrome c (
Figure 11.11
)[
41
]. Vesicles were formed as in
Figure 11.10
and observed by NBD fluorescence. Bar indicates 10 mm. (A) A vesicle viewed
immediately after the addition of 100 mM cytochrome c. Note no domains are visible. (B) A
similar vesicle after 30 min in the presence of 100 mM cytochrome c. Domains have formed.
(C) Avesicle as in Aviewed after 30 min in the presence of 10 mM cytochrome c. (D) Avesicle
as in B (domain formation induced by 100 mM cytochrome c) further incubated for 30 min
with 0.1 M NaCl. Fluorescent domains that are barely detectable in the presence of 10 mM
cytochrome c are obvious with 100 mM cytochrome c and are further augmented with
0.1 M NaCl [
41
]. This experiment demonstrated that cytochrome c can function in a manner
similar to Ca
2
þ
by inducing the formation of NBD-PA domains in a DOPC membrane. The
SDPC (18:0, 22:6 PC, T
m
¼
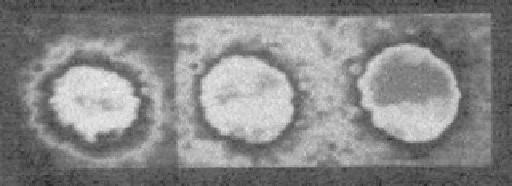
FIGURE 11.10
Fluorescence images of a Ca
2
þ
-induced anionic phospholipid (PA) domain. Vesicles were made
from the bulk lipid DOPC (99 mol% of the total phospholipids) to which 1 mol% of the fluorescent probe NBD-PA
was added. Images were taken 2, 15, and 30 min after the addition of 2 mM CaCl
2
. A faint fluorescent NBD-PA
domain can be detected 2 min after addition of 2 mM Ca
2
þ
. The domain grows and becomes more obvious after 15
and 30 min
[40]
.