Biology Reference
In-Depth Information
60
50
40
30
c
b
d
20
a
10
0
20
40 60
Molecular Area (A
2
/molecule)
80
100
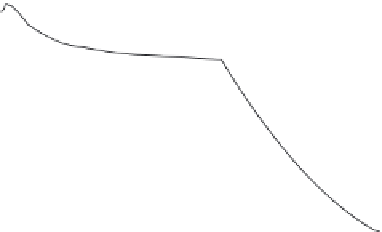
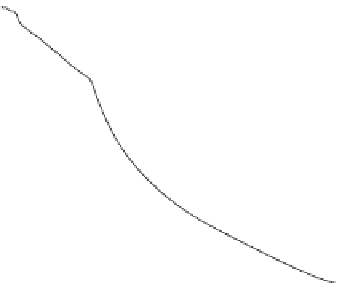
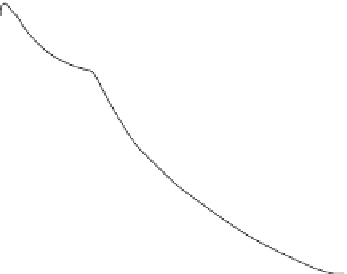
FIGURE 11.4
P
-A curves demonstrating 'squeeze out' in SM/18:0,22:6 PE/cholesterol monolayers. Monolayers
are composed of various mixtures of SM and 18:0,22:6 PC to which 0.05 mol fraction of cholesterol was added. The
mol fraction of 18:0, 22:6 PE in SM are: Curve a, 0.1; Curve b, 0.2; Curve c, 0.3; Curve d, 0.4. The 'squeeze out' of
18:0,22:6 PE is reflected by the plateau component that is most evident in curves b, c, and d.
[13]
.
Figure 11.4 [13]
. Monolayers were made of mixtures of SM and 18:0,22:6 PE containing an
additional 0.05 mol fraction cholesterol. This lipid mixture represents a model plasma
membrane/lipid raft. Upon increasing the lateral pressure, an 18:0,22:6 PE-dependent
plateau region emerged. The interpretation was that 18:0,22:6 PE was 'squeezed out' from
the SM/cholesterol (lipid raft) domain. The percent 'squeeze out' in the plateau portion of
p
/A curves is defined as:
A
b
Þ
100
Where L is the percentage of molecules lost or 'squeezed out', and A
b
and A
e
are the begin-
ning and end of the surface area of the near-horizontal ('plateau') region of the curve.
¼
1
ð
A
e
=
L
B. MEMBRANE PROTEIN DISTRIBUTION
Freeze Fracture Electron Microscopy
Freeze fracture electron microscopy (EM) was developed in the 1960s. It is an unusual tech-
nique that has been used to investigate membrane structure from the perspective of both the
membrane surface and the hydrophobic interior
[20]
. From this technique the distribution of
membrane integral proteins in the lipid milieu can be directly estimated. Freeze fracture EM is
based on rapidly freezing a membrane at very cold temperature (
100
C) followed by
fracturing using a knife. The fraction plane follows the weak point in the frozen sample,
the center of the membrane bilayer interior. This exposes the inner surface of both leaflets
<