Information Technology Reference
In-Depth Information
there a linear regression relationship between the dependent variable Y and any of
the independent variables X
i
used by the regression equation?
The statistical test
F
will answer the question.
The following value:
R
2
SSR
/
k
MSR
MSE
=
n
−
(
k
+
1
)
F
=
)]
=
R
2
·
(7.23)
SSE
/
[
n
−
(
k
+
1
1
−
k
provides the ratio between the variance explained by the regression model (given
by the
MSR
) and the unexplained variance (given by the
MSE
). It is well-known in
the literature that, under the hypothesis that
F
is a ratio of unrelated variances, its
value follows an
F
[
k
,
n
−
k
+
1
]
-distribution (with
k
and
n
degrees of freedom),
a probability density distribution which takes the name of the English statistician
Sir Ronald A. Fisher and is widely used in statistics to compare the distribution
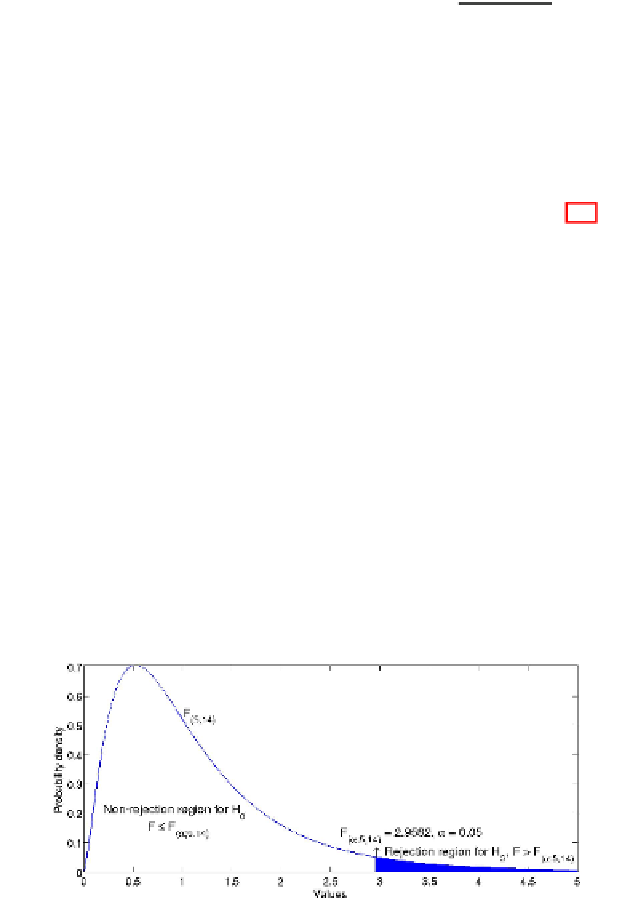
of two populations and to carry out the analysis of variance. In Fig. 7.8, the plot
of an
F
-distribution with 5 and 14 degrees of freedom is depicted, the one which
should be used, for example, when we want to test a regression model which fits
n
−
(
k
+
1
)
=
20 data points by means of
k
=
5 independent variables. After having fixed
a
significance level
for the test, which specifies the probability of error of the
test, we can reject the null hypothesis
H
0
when the value of the
F
-ratio of a given
regression model is greater than a threshold value
F
[
α ;
k
,
n
−
(
k
+
1
)]
α
. This value divides
theareaofthe
F
-distribution in two different parts of cumulative probabilities 1
−
α
and
05, then we can conclude, with 5% probability
of being wrong, that there exists a linear relationship between
Y
and any of the
independent variables occurring in the regression equation, when the value of the
F
-
ratio is greater than
F
[
α
α
, respectively. If we fix
α
=
0
.
. In the case of considering the distribution
F
(
,
;
k
,
n
−
(
k
+
1
)]
5
,
14
)
this value is equal to 2
.
9582. The value of
F
[
α ;
k
,
n
−
(
k
+
1
)]
is called the
critical value
of
F
[
k
,
n
−
(
k
+
1
)]
for
. In the literature, some tables are given which provide the right
values of
F
[
α ;
k
,
n
−
(
k
+
1
)]
for different values of
α
α
and of the degrees of freedom of the
F
-distribution.
Fig. 7.8
The plot of the
F
-distribution
F
(
5
,
14
)
with 5 and 14 degrees of freedom. The full
right-tailed area of 0
.
05 is the one which represents the rejection region for the null hypothesis
H
0
defined in Table 7.7