Database Reference
In-Depth Information
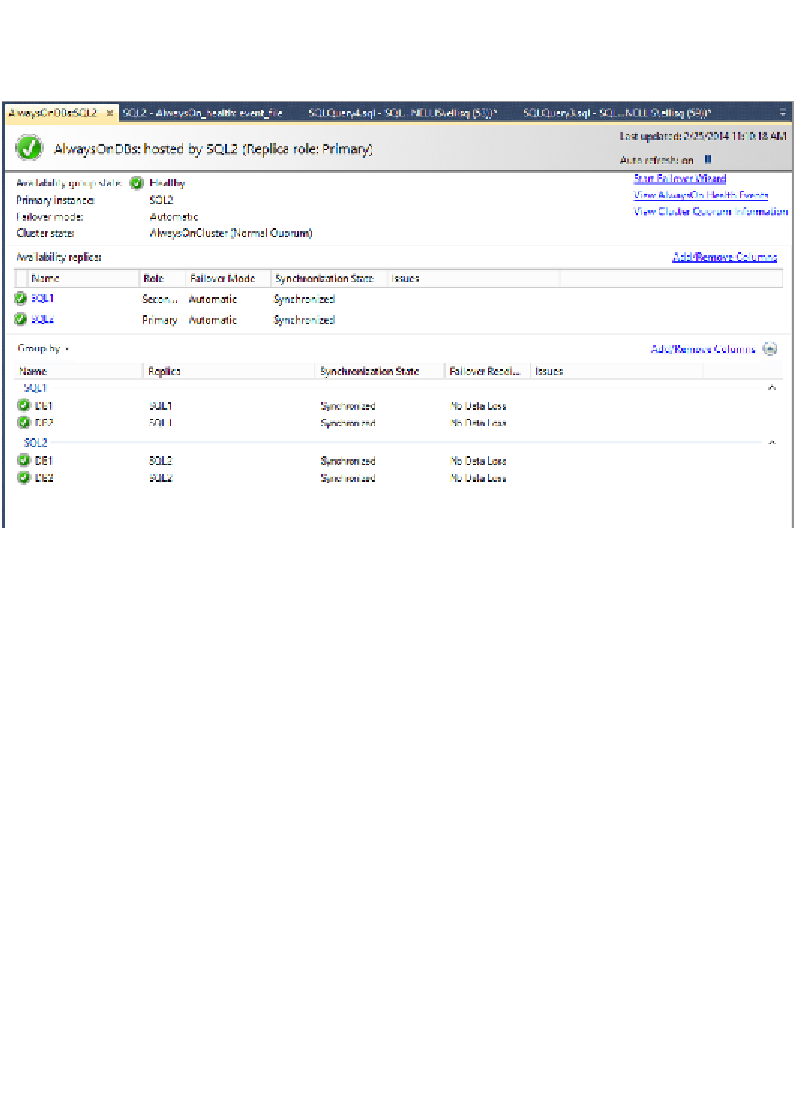
You can start the dashboard by right-clicking on your Availability Group in
Object
Explorer
and then clicking on
Show Dashboard
. You will see a screenshot similar
to the following one:
This is very similar to the dashboard in SQL Server 2012, but there have been some
enhancements in SQL Server 2014. You can now add additional columns to give you
extra information about the Availability Group.
If you click on the
Add/Remove Columns
link in the
Availability Replica
section,
you can add columns that give extra information about your Availability Group.
Click on the
Availability Mode
column to add it to the dashboard. This tells you
which commit mode each replica is using. In the
Group by
section, click on the
Add/Remove Columns
link and add
Estimated Recovery Time
to the dashboard.
This provides an estimate on how long the database will take to recover if it
becomes primary.
Search WWH ::

Custom Search