Biology Reference
In-Depth Information
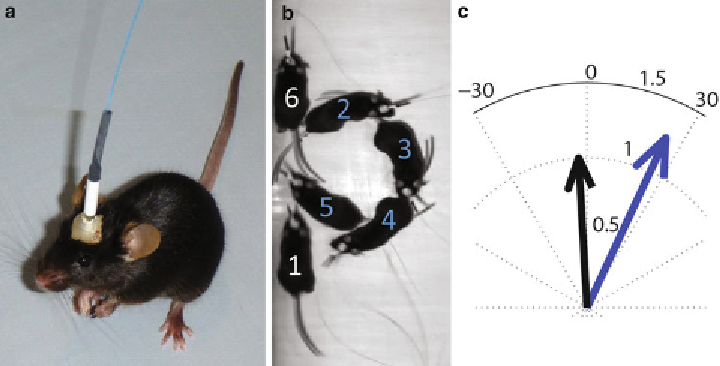
Fig. 2
Optogenetic stimulation of virally transduced motor cortex. (
a
) Mouse implanted with fi beroptic connec-
tor, after recovery from surgery. Fiberoptic patch-cable is attached to the implant, allowing for light delivery
into the targeted region. (
b
) Overlay image indicating the position of the mouse before light stimulation (
1
),
during stimulation (
2
-
5
) and after stimulation (
6
). Stimulation was performed using a 447 nm diode laser at a
frequency of 13 Hz and pulse width of 5 ms for 6 s intervals. (
c
) Radial plot depicting the average speed and
direction of movement of the mouse during no-stimulation trials (
black
) compared with stimulation trials (
blue
).
The mouse's body position was tracked and the average direction of motion was calculated at 2 Hz sampling
intervals. The vector length, representing mouse velocity, was normalized to control periods
activation of the left primary motor cortex leads to a bias in the
average direction of locomotion toward the right, resulting in cir-
cular walking trajectories (Fig.
2
). Following behavioral testing we
verifi ed the site of injection and observed substantial transduction
in the targeted region (Fig.
3
).
3
Notes
1. Alternatively, tools can be sterilized by autoclaving or soaking
in disinfectant.
2. Brain atlases are usually of adult mice (8 weeks or older) and
variations can arise from using different strains and ages. If
mice are younger, appropriate adjustments to the target coor-
dinates should be made. The average lambda-bregma distance
in C57BL/6J mice, reported in [
64
], is 4.21 mm. A scaling
factor for the stereotaxic coordinates can be obtained by divid-
ing the actual distance in the given mouse by this value.
3. This protocol uses isofl urane for anesthesia and buprenor-
phine for analgesia. Alternatively, ketamine and xylazine or any
other suitable and approved anesthetic can be used.
Search WWH ::

Custom Search