Database Reference
In-Depth Information
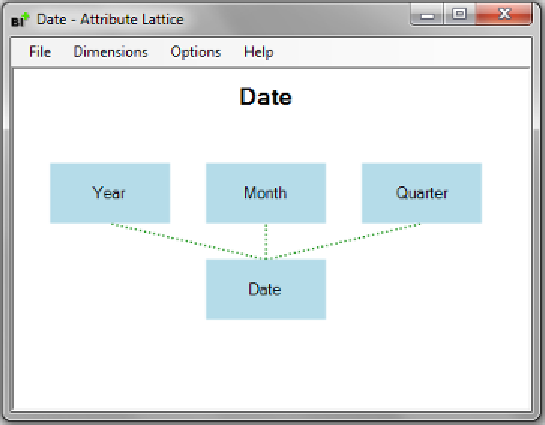
If you have
BIDS Helper
installed, right-clicking on the dimension in the
Solution
Explorer
window and selecting
Visualize Attribute Lattice
will display something
like what's shown in the following screenshot. The built-in functionality, in our
opinion, sacrifices clarity in favor of saving space, and the BIDS Helper visualization
is easier to understand. BIDS Helper displays each attribute as a separate node in
its relationship diagram, whereas on the
Attribute Relationships
tab, multiple
attributes are sometimes displayed in the same node.
You can see that in our example using
Year
,
Quarter
,
Month
, and
Date
attributes on
a
Time
dimension, Analysis Services knows that a year is made up of many dates, a
quarter is made up of many dates, and a month is made up of many dates, but not
that years are made up of quarters or that quarters are made up of months. Changing
the attribute relationships to reflect these facts gives you something resembling a long
chain, and in general the more long chains you see in your attribute relationships
the better. As Analysis Services understands transitory relationships, there's no need
to define a relationship between
Year
and
Date
, for example, because it can see
that there is an indirect relationship via
Quarter
and
Month
. In fact, defining such
redundant relationships can be a bad thing from a performance point of view.

Search WWH ::

Custom Search