Biology Reference
In-Depth Information
10
−1
10
−4
10
−5
10
−2
10
−6
10
−3
10
−7
0
500
1000
1500
2000
0
500
1000
1500
2000
time (minute)
time (minute)
10
−4
10
−5
10
−6
10
−7
0
500
1000
1500
2000
time (minute)
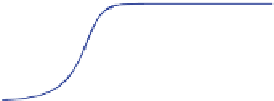
FIGURE 2.5
Time series simulation of the mRNA,
-galactosidase and allolactose concentrations.
These plots were produced by numerically solving the 3 variable model when
L
β
=
10
−3
mM. For this value of the internal lactose concentration, there exist three
coexisting steady states (see Figure
2.4
). The (
50
×
)'s in these plots represent the location
of the low and high stable steady states. See the text for selection of the initials.
∗
in the presence of external lactose. Now suppose that three molecules of allolactose
are needed for effective blockage of the repressor protein. Numerically study how
this will affect the bistability range in this system. Use the 3 variable model and the
parameter values given in Table I in the paper [
8
]. You should take the Hill coefficient
as
n
3.
MATLAB starter code is provided for this exercise. Open the file
Code_for_Ex_2_
4_Starter.m
and add the appropriate lines of code. Note that this exercise requires the
use of the MATLAB's Global Optimization Toolbox.
=
The 5 variable model was analyzed in a similar way. Figure
2.6
shows a plot of
the allolactose steady state values as responses to the external lactose concentration
in the 5 variable model. To produce this plot, the system of nonlinear equations in
Table
2.2
was solved for a range of
L
e
values after setting each of the time derivatives


Search WWH ::

Custom Search