Biology Reference
In-Depth Information
10
0
10
−1
10
−2
10
−3
0.01
0.02
0.03
0.04
0.05
0.06
0.07
Le (mM)
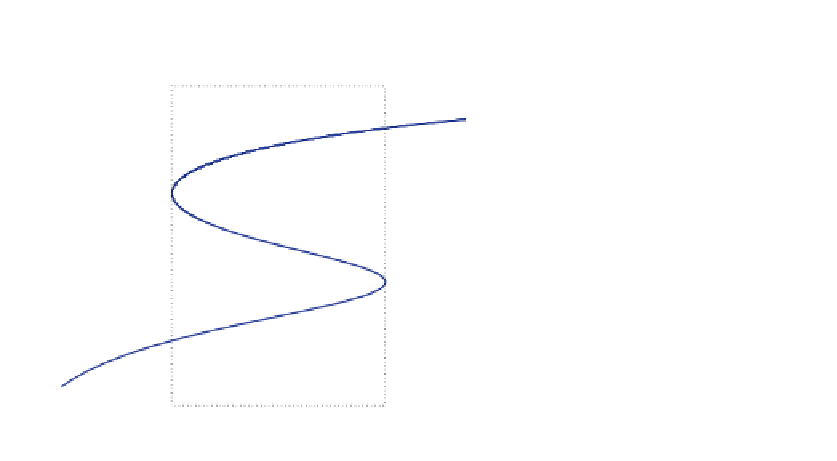
FIGURE 2.6
Bistability arises in
L
e
;A
∗
)
space in the 5 variable
lac
operon model. Notice that the
y
-axis is in the logarithmic scale and there exists a range of
L
e
concentrations for which
there are three coexisting steady states for the allolactose concentration. We estimated
this range to be (0.027,0.062) mM of
(
[
L
e
]
.
Table 2.4
The steady state values calculated from the 5 variable model when
L
e
=
10
−3
mM for which there exist three steady states (see Figure
2.4
).
Steady States
A
∗
(mM)
50
×
M
∗
(mM)
B
∗
(mM)
L
∗
(mM)
P
∗
(mM)
10
−3
10
−6
10
−6
10
−1
10
−5
I
7
.
85
×
2
.
48
×
1
.
68
×
1
.
69
×
3
.
46
×
10
−2
10
−6
10
−6
10
−1
10
−4
II
2
.
64
×
7
.
58
×
5
.
13
×
2
.
06
×
1
.
05
×
10
−1
10
−4
10
−4
10
−1
10
−3
III
3
.
10
×
5
.
80
×
3
.
92
×
2
.
30
×
8
.
09
×
to zero. As seen in (Figure
2.6
), there is a range of
L
e
concentrations for which there
are three coexisting steady states for the allolactose concentration.
Table
2.4
shows the three steady states calculated from the 5 variable model when
the extracellular lactose concentration is
L
e
=
10
−
3
. To compute those steady
states, the time derivatives in the model equations given in Table
2.2
are set to zero
and the system of nonlinear equations is solved numerically while all the parameters
are kept constant at their estimated values.
Figure
2.7
shows time-series simulations for the time evolution of mRNA,
50
×
-
galactosidase, allolactose, lactose, and permease concentrations in the 5 variable
model when the extracellular lactose concentration is
L
e
=
β
10
−
3
mM. There are
three coexisting steady states for this value of
L
e
(see Figure
2.6
and Table
2.4
), two
50
×


Search WWH ::

Custom Search