Information Technology Reference
In-Depth Information
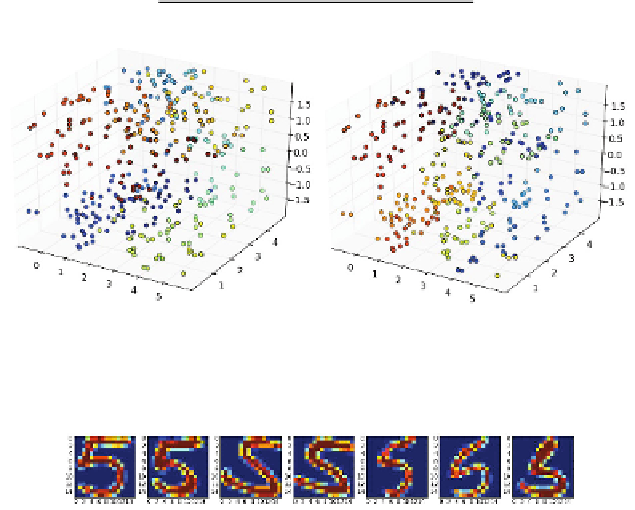
Figure 8 shows two UNN
g
embeddings of the handwritten digits data set for
=2
.
0
(a), and
=20
.
0
(b). For both settings similar digits are neighbored in latent space. But
we can observe that for
=20
.
0
a broader variety in the data set is covered. The loss
function does not concentrate on fitting to noisy parts of the data, but has the capacity
to concentrate on the important structures of the data.
Ta b l e 3 .
Influence of
-insensitive loss on final DSRE of UNN on the digits data set
digits
5
's
digits
7
's
UNN
g
UNN
g
UNN
UNN
0.0
423.8
440.2
225.4
222.8
1.0
423.8
440.2
225.4
222.8
2.0
423.8
440.2
225.6
222.8
3.0
423.5
440.2
238.1
221.0
4.0
441.3
440.2
262.1
218.2
5.0
488.7
432.3
264.8
221.4
6.0
496.9
434.2
265.6
220.8
10.0
494.6
434.3
268.4
220.8
(a) UNN,
=0
.
8
(b) UNN
g
,
=3
.
0
Fig. 7.
Visualization of the best UNN and UNN
g
embeddings (lowest DSRE, bold values in
Table2)of3D-S
h
with noise
σ
=5
.
0
(a)
=2
.
0
(b)
=20
.
0
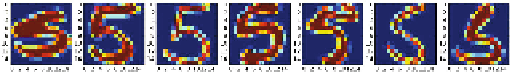
Fig. 8.
Comparison of UNN
g
embeddings of 5's from the handwritten digits data set. The figures
show every 14th embedding of the sorting w.r.t. 100 digits for
=2
.
0
,and
=20
.
0
.