Database Reference
In-Depth Information
Adding a report item
Now that the report contains a data source and a dataset, you are ready to create a
report item to display the data in a meaningful way on the report. In this exercise,
you will create a line chart to display year-over-year sales trends.
1. Right-click in a blank area of the report body, and navigate to
Insert
|
Chart
.
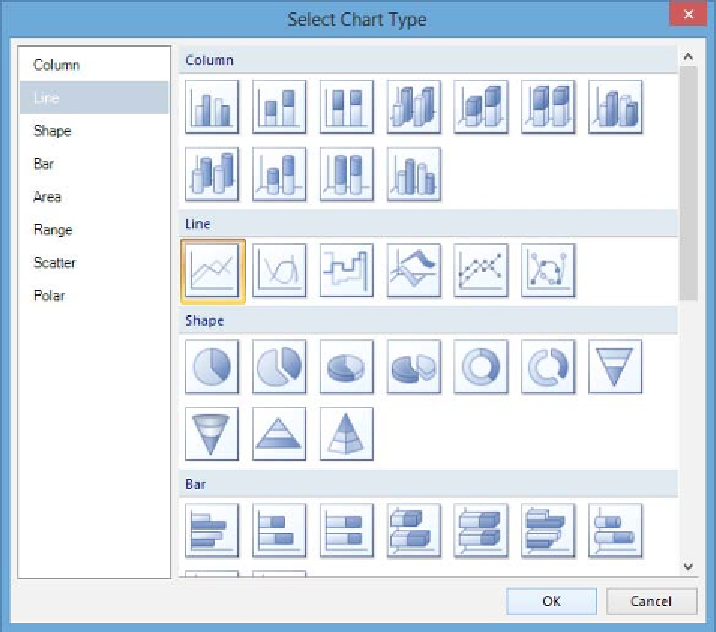
2. Select the first option in the
Line
section, and click on
OK
to create a
Line
Chart
report item, as shown in the following screenshot:
3.
Click on the chart item that was created on the report body, move it to the
upper-left corner of the report canvas, and then drag out the bottom-right
corner to make the chart larger.