Database Reference
In-Depth Information
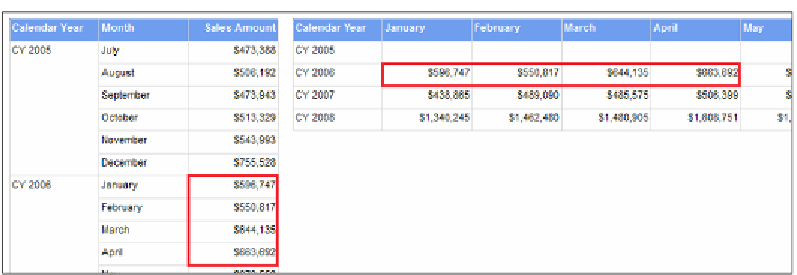
Example of the differences when displaying data in a table (left) versus a matrix (right)
•
Rectangle
: This report item is a container used for grouping sets of report
components placed within them. The group of report components can then
be published to the report server as a single shared report part that can be
reused in other reports. Rectangles can also be placed inside other report
components such as the cells of a table.
•
List
: This report item, like the table and the matrix, is based on the
underlying tablix data structure. The difference is that a list is used to
create repeating areas in which additional report components can be
placed in order to create what is known as a free-form report.
•
Image
: This report item is used to display a graphic, such as a company
logo or product picture on the report. The image can be embedded in the
report, but it is more common to have the image stored as a separate item
on the report server, in a database, or somewhere out on the Web and then
referenced from the report and displayed at runtime.
•
Subreport
: This report item is used to display the contents of another report
(from the same report server) within the main report. The primary purpose
of this report component is to promote encapsulation of information and
reuse of existing development. However, from a performance perspective, it
is typically a better idea to use the Nested Data Region design pattern, which
you can read about in the following TechNet article:
http://technet.
microsoft.com/en-us/library/dd207033.aspx
.