Environmental Engineering Reference
In-Depth Information
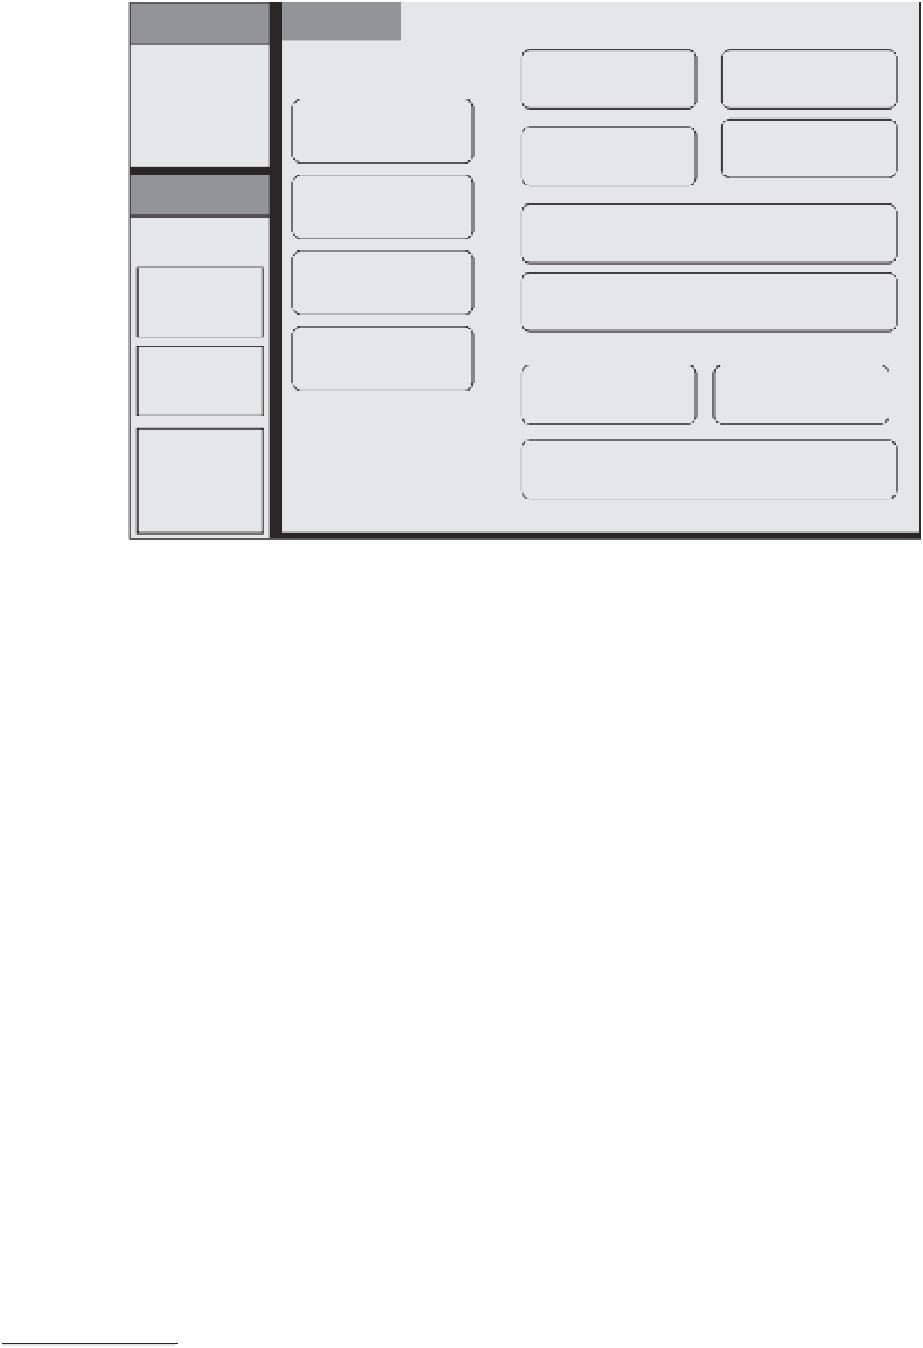
Models
Input data
Climate,
landscape,
vegetation,
socio-
economics
Potential
evapotranspiration
Fog interception
Terrain derivatives
and hydrography
Actual
evapotranspiration
Snow dynamics
Scenarios and
policy options
Fog frequency
Water balance
Cloudiness
Climate
change
Runoff
Solar radiation
Land cover
change
Soil erosion
Soil deposition
Land
management
interventions
Water quality
Figure 20.1
Main components of the WaterWorld System.
process of making PSS more useful, (a), since users can
continue to drive model-development paths.
It works by spatial application of a series of process-
based sub-models for key hydrological and soil erosion
processes (see Figure 20.1) to supplied raster datasets
describing climate, landscape, vegetation and hydrology.
The system can be run at national scales at 1 km
2
spatial
resolution and at local scales at 1 hectare resolution. For
the 1 hectare resolution runs, only the terrain datasets
are native 1 hectare resolution and all other datasets are
interpolated from datasets at native resolutions varying
between 1-hectare and 1 km
2
. WaterWorld uses a raster
data model and a monthly timestep. It represents the
baseline using mean climate data from 1950-2000. All
data required to run simulations are supplied globally
and WaterWorld produces a range of outputs that can
be visualized online, using ubiquitous and user-friendly
geobrowsers such as Google Earth and Google Maps, or
downloaded for GIS analysis. Geobrowsers have become
a familiar and useful tool in policy support, especially in
data-poor situations. The mapped data, high-resolution
imagery (which can be better than locally available data)
and ease of use of geobrowsers means that they are heavily
used. Indeed the official Google blog
14
reports more than
1 billion downloads of Google Earth. Using geobrowsers
as the visualization platform for sophisticated policy-
support systems was therefore an obvious choice.
20.2.1 WaterWorld
WaterWorld
13
is a spatial policy-support system focused
on better understanding the hydrological baseline of an
area and the impact of land use, land management and cli-
mate change on that baseline. It is applicable globally and
has been built as a self-parameterizing, web-based model
in order to overcome the availability and utility barriers.
In order to facilitate the building of self-parameterizing
models, a significant effort had to be invested in the
collection, processing, integration and harmonization of
the required input data on a global scale. The resulting
database of raster datasets at standardized 1 km
2
and
1-hectare spatial resolutions (referred to as SIMTERRA)
is the foundation for WaterWorld and a number of
other decision-, policy- and negotiation- support systems
developed within a web-based PSS framework (referred
to as ECOENGINE).
WaterWorld was developed to reduce further the bar-
riers to the use of spatial modelling in policy support. It is
intended to meet the need for spatial hydrological base-
lines and understanding of the impact of land-use and
climate change in environments throughout the world.
14
See http://googleblog.blogspot.com/2011/10/google-earth-
downloaded-more-than-one.html (accessed 6 April 2012).
13
See www.policysupport.org/(accessed 6 April 2012).


Search WWH ::

Custom Search