Agriculture Reference
In-Depth Information
Table 5.1
Land use zones in Hadyao Village (Hadyao Village, 2005)
Land use zones
%
Area (ha)
Conservation forest
700
15.2
Protection forest
1,300
28.3
Agricultural land
1,700
36.9
Production (plantation) forest
700
15.2
Grazing area
200
4.3
Residential area
4
0.1
Total
4,604
100.0
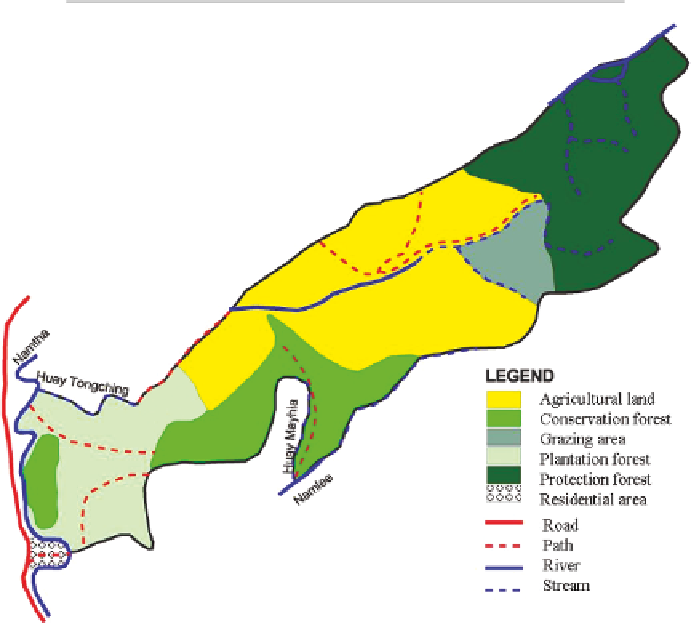
Fig. 5.2
Resource map of Hadyao village (Hadyao Village, 2005)
From the household survey, the average number of cultivated plots per house-
hold was 3.5. Over 90 percent of the households had between two and five plots
(Table 5.2). The total cultivated area averaged 5.1 ha. Most households were clus-
tered around the mean; 85 percent had from 1.9 to 7.7 ha. Two thirds of the house-
holds had all their plots within the village territory, while the remainder had one or
more plots in another village's territory (Table 5.3), an indication of the increasing
pressure on the village's available land. About 80 percent had land use rights to all
the plots they cultivated, while 20 percent had borrowed or rented at least one plot
of land because their allocated lands were already planted with rubber (Table 5.3).
Search WWH ::

Custom Search