Environmental Engineering Reference
In-Depth Information
Table 2.
Adjusted odds ratios (ORs) using a design-based logistic regression of malaria infection
for
Plasmodium vivax
(Pv) and
Plasmodium falciparum (Pf)
by age, gender, month, and village of
residence in Gilgel-Gibe dam area, south-western Ethiopia, 2005.
Variable
Adjusted
OR Pv
p-value
Adjusted
OR Pf
p-value
Adjusted
OR Plas-
modium
postivity
p-value
Village
'at risk'
1.63
0.015 **
2.40
0.085 *
1.97
0.013**
'control'
1.00
¨
1.00.
¨
1.00
¨
Month
October
1.00
¨
1.00
¨
1.00
¨
November
0.88
0.428
0.39
0. 199
0.68
0.200
December
0. 18
0.096 *
0.89
0.828
0.41
0.062*
Age (yrs)
<I
1.00
¨
1.00
¨
1.00
¨
1-4
1.19
0.209
1.17
0.241
1.20
0.083*
5-9
1.15
0.710
.94
0.890
1.08
0.837
Sex
Male
1.00
¨
1.00
¨
1.00
¨
Female
1.79
0.054
0.87
0.541
1.33
0. 146
* = signifi cant at 0.1 level ** = signifi cant at 0.05 level
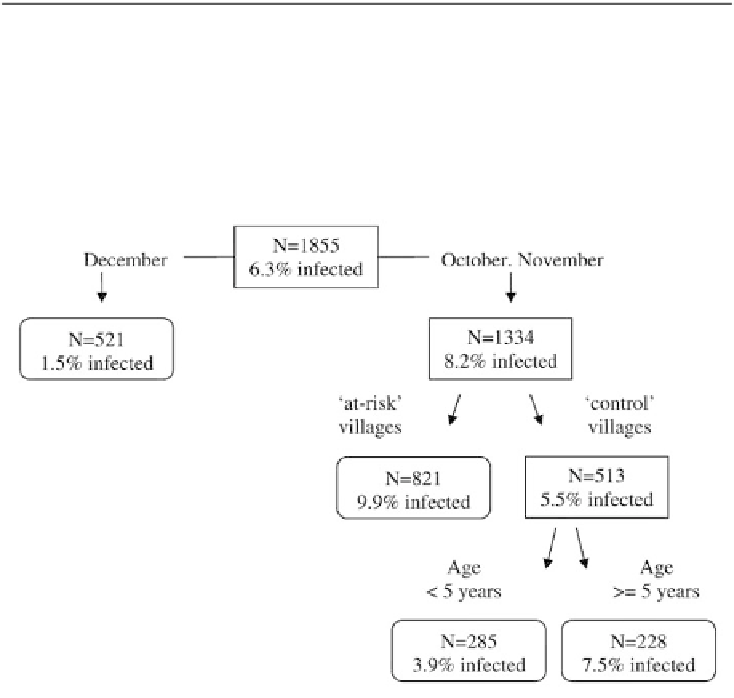
Figure 2 shows the classifi cation tree for
P. vivax
reproduced by CART. The children
are fi rst split into two groups: those sampled in December (prevalence = 1.5%) and
those sampled in October-November (prevalence = 8.2%). The group of children sam-
pled in October-November was further split in children living in “at-risk” communities
Figure 2.
Classification tree of the risk factors for
P. vivax
infection.


Search WWH ::

Custom Search