Environmental Engineering Reference
In-Depth Information
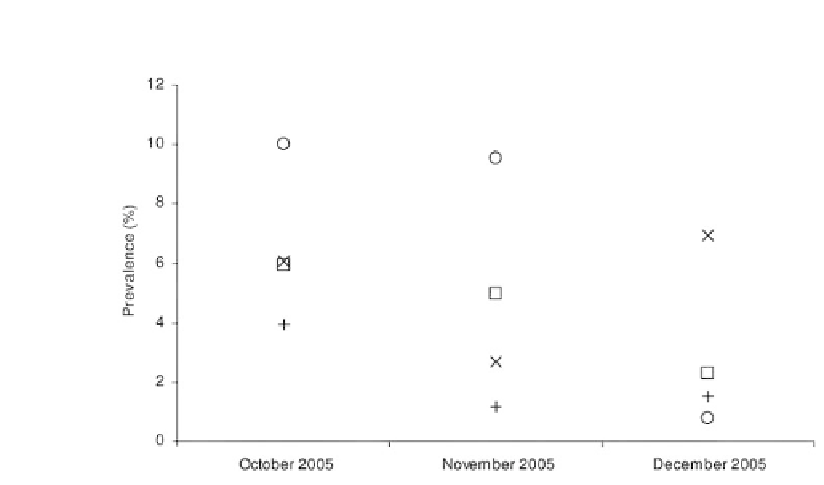
Figure 1.
Prevalence rates for
P. vivax
in “at-risk” (squares) and “control” villages (circles) and for
P.
falciparum
in “at-risk” (x-signs) and “control” villages (+-signs).
In general, signifi cantly higher malaria prevalence was observed in children liv-
ing within 3 km from the reservoir than those living farther away (OR = 1.81, 95%
CI = 1.17, 2.79 for
P. vivax
and OR = 2.57, 95% CI = 1.01, 6.57 for
P. falciparum
)
(Table 1).
P. vivax
prevalence rates differed signifi cantly between “at-risk” and
“control” communities among children 1-4 years of age (OR = 1.81, 95% CI =
1.21, 2.71) and
P. falciparum
prevalence rates differed signifi cantly between “at
risk” and “control” communities among 5-9 years of age (OR = 17.4, 95% CI =
1.22, 249.24).
Moreover, in a multivariate analysis controlling for age, sex, and time of data
collection, it appeared that children who resided in “at-risk” villages close to the dam
were more likely to have a
P. vivax
infection than children who resided in “control”
villages (OR = 1.63, 95% CI = 1.15, 2.32) (Table 2). The results in Table 2 further
indicate a
P. vivax
infection difference between boys and girls, however this was
not signifi cant at the 0.05 level (p = 0.054). The multivariate analysis indicated that,
while controlling for age, sex, and time of data collection, children who resided in
“at-risk” villages close to the dam had a higher OR to have
P. falciparum
infection
than children who resided in “control” villages but this was not signifi cant at the 0.05
level (OR = 2.40, 95% CI = 0.84, 6.88). Finally, while controlling for age, sex, and
time of data collection, children who resided in “at-risk” villages close to the dam
were at a higher risk to have a Plasmodium infection (
P. falciparum
and
P. vivax
combined) than children who resided in “control” villages (OR = 1.97, 95% CI =
1.24, 3.12) (Table 2).


Search WWH ::

Custom Search