Chemistry Reference
In-Depth Information
These results serve as an illustration of the degree of agreement of the quantitative
analyses obtained by this technique and classical methods. In several instances the
agreement of the results is good. However, large differences found for some sample
constituents (especially macro constituents) must be ascribed to a lower accuracy of the
classical methods, as is clear from the analyses of model mixtures summarised in Table
14.5.
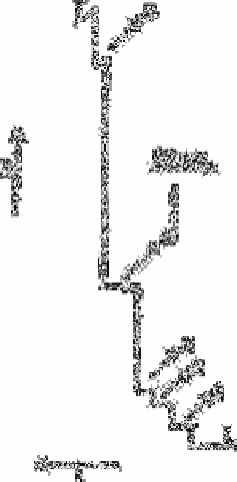
Fig. 14.2
Isotachopherogram for the separation of anions in the first stage using
operational system No. 1:1, nitrate (40mg L
−1
); 2, sulphate (20mg
L
−1
); 3, nitrite (20mg L
−1
); 4, fluoride (20mg L
−1
); 5, phosphate
(20mg L
−1
). Driving current 250µA. L and T= leading and
terminating anions, respectively; R=increasing resistance,
t=increasing time. The sample was introduced with the aid of a 30µL
valve
Source: Reproduced with permission from Elsevier Science [47]
Table 14.3
Determinations of inorganic anionic macro constituents present in river water
Sulphate
(mg L
−1
)
Nitrate
(mg L
−1
)
Chloride
(mg L
−1
)
Sample No
.
Titrimetry
a
IPT
Spectro-photometry
b
ITP
ITP
Titrimetryc
1
36.6
41.6
13.2
11.7
18.9
31.2
2
40.8
34.4
13.6
12.3
23.0
33.2


Search WWH ::

Custom Search