Chemistry Reference
In-Depth Information
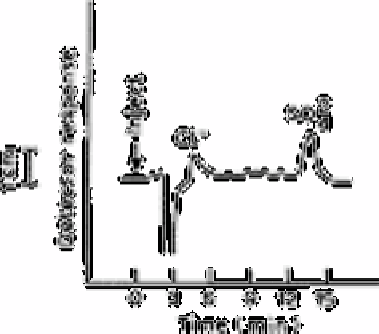
Fig. 12.39
Standard containing 19µg L
−1
chloride and 22µg L
−1
sulphate
concentrated from 20.0ml; eluant, 2.0×10
−4
potassium phthalate, pH
6.2; concentrator column resin, XAD-4 0.5mequiv g
−1
; separator
column resin,XAD-1 0.013mequiv g
−1
, 44-57µm
Source: Reproduced with permission from the American Chemical
Society [80]
chloride and sulphate in 'pure' water were used to plot standard addition calibration
graphs. A straight line of the form
y
=0.401x+1.56 and a correlation coefficient of 0.997
were obtained for chloride and
y
=0.516x +3.70 and a correlation coefficient of 0.995
were obtained for sulphate. Extrapolation of these plots showed a 4.0µg L
−1
chloride
concentration and 6.5µg L
−1
sulphate concentration for this sample of 'pure' water.
Detection limits under these conditions were 3-5µg L
−1
.
Ion chromatography has been employed to analyse mixtures of chloride, nitrite and
sulphate in amounts down to 1µg L
−1
in high purity waters [83].
12.10
Boiler feed waters
12.10.1
Chloride, sulphate and nitrite
The Roberts [80] procedure described in section 12.9.1 has been applied to the analysis of
boiler feed waters.
12.10.2
Sulphate and orthophosphate
Ion chromatography has been used to analyse mixtures of sulphate and orthophosphate in
boiler blow down water [84].
Search WWH ::

Custom Search