Chemistry Reference
In-Depth Information
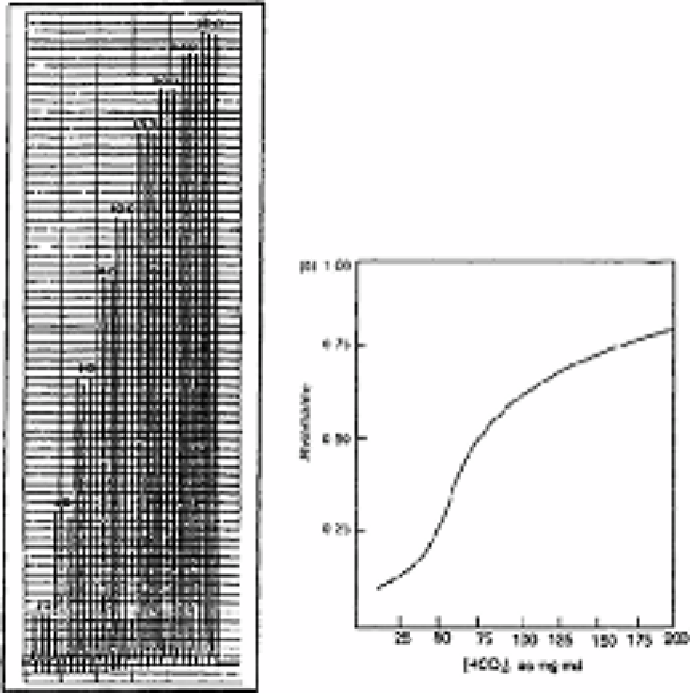
Fig. 7.2
Calibration peaks obtained with 10cm
2
buffer solution diluted to
100cm
3
with distilled water. The values on top of the peaks represent
mg L
−1
bicarbonate ions, (b) Corresponding calibration graph
Source: Reproduced with permission from United Trades Press [1]
7.1.2
Spectrophotometric method
Van Staden and Van Vleit [2] have described a dimple, automated procedure for
determining total alkalinity in potable water. Up to 120 samples per h can be analysed
with a coefficient of variation of better than 1.4%.
Table 7.1
Comparison of results obtained by the FIA method, the electrometric method
and the automated segmented bromocresol green methoda
Sample
Automated
Electrometric method
FIA method
Coefficient of


Search WWH ::

Custom Search