Chemistry Reference
In-Depth Information
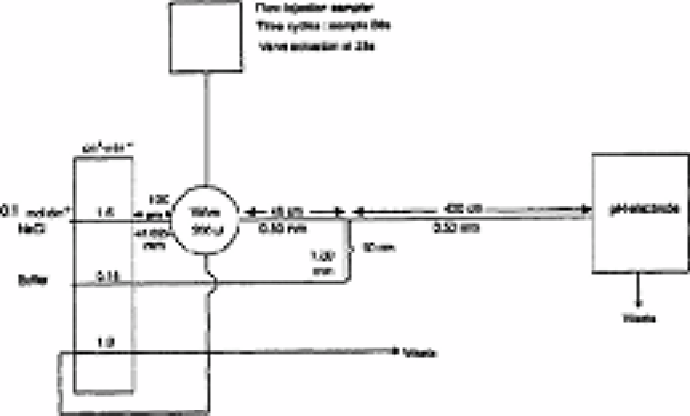
Fig. 7.1
Flow system for the determination of total alkalinity. Sampling rate
120 samples h
−1
. Tube length and diameters are given in cm and mm
Source: Reproduced with permission from United Trades Press [1]
The sampling valve actuates every 28s after movement of the sampler to the next sample.
Fig. 7.2 shows the appearance of recorder tracing as well as calibration curves when
analysing a series of standards in the range 20-300mg L
−1
bicarbonate solution. The
results indicate linearity in the range 30-75mg L
−1
.
In Table 7.1 a comparison is made of results obtained by the above flow injection
method, by an electrometric titration method, and by an automated bromocresol green
indicator method.
Flow injection results compare favourably with a standard electrometric method and in
some instances better results were obtained when compared to the automated
bromocresol green method. This is probably due to colour interferences from these water
specific samples. Student's t-test was applied in comparing both sets of results with the
manual electrometric method. Table 7.1 reflects these calculations. Both procedures give
results that differ to a statistically insignificant extent when compared to the electrometric
procedure. However, the difference between the procedures is smaller than the difference
between the continuous flow procedure and the electrometric procedure.
Search WWH ::

Custom Search