Biomedical Engineering Reference
In-Depth Information
"C1" Node 10
"C2" Node 10
1
1
Monopolar
Bipolar
Tripolar
Monopolar
Bipolar
Tripolar
0.8
0.8
0.6
0.6
0.4
0.4
0.2
0.2
0
0
−0.2
−0.2
−0.4
−0.4
−0.6
−0.6
0
5
10
15
20
25
30
35
0
5
10
15
20
25
30
35
[mm]
[mm]
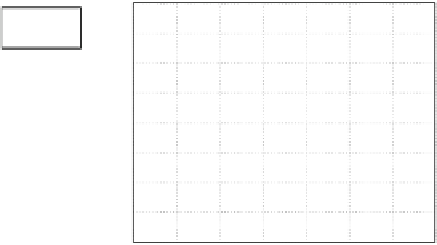
Fig. 10
Extracellular voltage for two cochlea anatomies “C1” (
left
) and “C2” (
right
) for different
stimulation modes: monopolar, bipolar and tripolar
Ta b l e 5
Spread of excitation width at node 10 for two different cochlear geometries “C1” and
“C2” and for different stimulation modes
C1 (mm)
C2 (mm)
Monopolar
1.78
0.9
Bipolar
1.25
1.3
Tripolar
0.78
0.75
Again from Table
5
, it can be observed that the dimensions of the cochlea have
an influence on the width of the spread of excitation for different stimulation modes.
For the cochlea “C2” bipolar stimulation produces a wider spread of excitation than
monopolar.
3.4 Experiment 4: Automatic Instrument Identification Using
the Model of the Electrically Stimulated Cochlea
We used the FEM model to simulate the excitation patterns produced by different
instrumental sounds with very similar spectral characteristics. A sound coding strat-
egy, similar to these used in commercial sound processors, is used to process the
instrumental sounds and compute the currents that are applied to the electrodes in
the FEMmodel. More details about the sound coding strategies can be obtained from
[
13
,
14
].
The extracellular voltage distribution obtained from the model is added with a
white gaussian noise component. This additive noise component is necessary to
increase the sensitivity of the classifier (Fig.
11
). Finally, a discrete cosine transform
(DCT) is applied over the noisy voltage. The reason for using the DCT is to focus the