Database Reference
In-Depth Information
Dynamic Management Objects
To get an immediate snapshot of a large amount of data that was formerly available only in Performance Monitor,
SQL Server offers some of the same data, plus a lot of different information, internally through a set of dynamic
management views (DMVs) and dynamic management functions (DMFs) collectively referred to as
dynamic
management objects
(DMOs). These are extremely useful mechanisms for capturing a snapshot of the current
performance of your system. I'll introduce several DMOs throughout the topic, but for now I'll focus on a few that are
the most important for monitoring server performance and for establishing a baseline.
The sys.dm_os_performance_counters view displays the SQL Server counters within a query, allowing you to
apply the full strength of T-SQL to the data immediately. For example, this simple query will return the current value
for Logins/sec:
SELECT dopc.cntr_value,
dopc.cntr_type
FROM sys.dm_os_performance_counters AS dopc
WHERE dopc.object_name = 'SQLServer:General Statistics'
AND dopc.counter_name = 'Logins/sec';
This returns the value of 200 for my test server. For your server, you'll need to substitute the appropriate server
name in the object_name comparison if you have a named instance. Worth noting is the cntr_type column. This
column tells you what type of counter you're reading (documented by Microsoft at
http://bit.ly/1mmcRaN
)
. For
example, the previous counter returns the value 272696576, which means that this counter is an average value. There
are values that are moments-in-time snapshots, accumulations since the server started, and others. Knowing what the
measure represents is an important part of understanding these metrics.
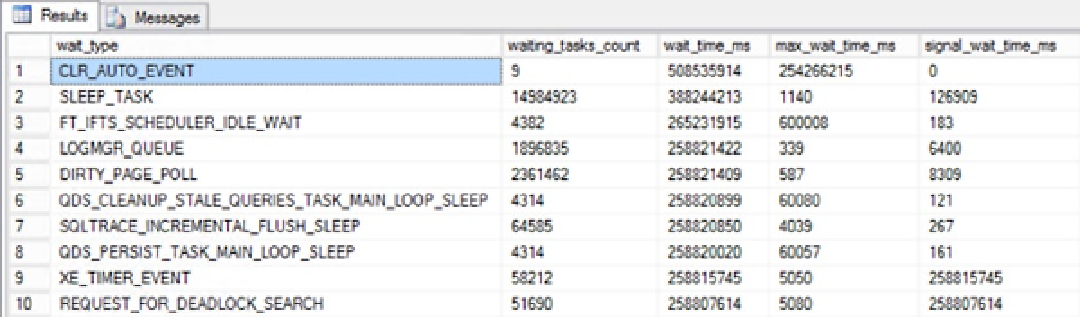
There are a large number of DMOs that can be used to gather information about the server. I'll introduce
one more here that you will find yourself accessing on a regular basis, sys.dm_os_wait_stats. This DMV shows an
accumulated view of the threads within SQL Server that are waiting on various resources, collected since the last time
SQL Server was started or the counters were reset. The wait times are recorded after the work is completed, so these
numbers don't reflect any active threads. Identifying the types of waits that are occurring within your system is one of
the easiest mechanisms to begin identifying the source of your bottlenecks. You can sort the data in various ways; this
first example looks at the waits that have the longest current count using this simple query:
SELECT TOP (10) dows.*
FROM sys.dm_os_wait_stats AS dows
ORDER BY dows.wait_time_ms DESC;
Figure
2-2
displays the output.
Figure 2-2.
Output from sys.dm_os_wait_stats