Database Reference
In-Depth Information
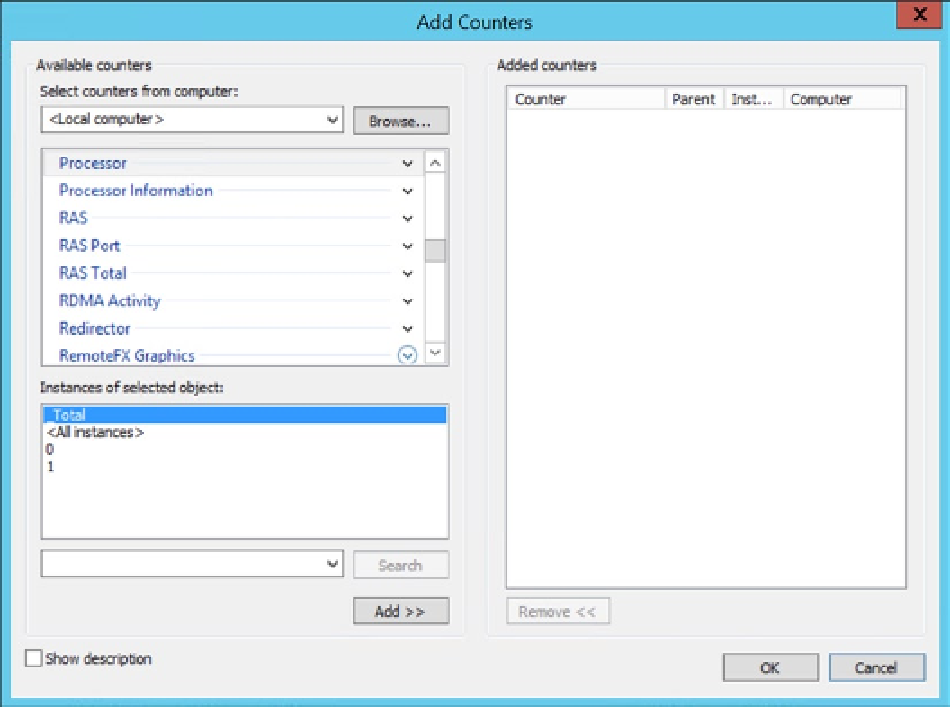
usage of a computer with two processors can be determined using the following performance object, counter, and
instance (as shown in Figure
2-1
):
•
Performance object
: Processor
•
Counter
:
%
Processor Time
•
Instance
: _Total
Figure 2-1.
Adding a Performance Monitor counter
System behavior can be either tracked in real time in the form of graphs or captured as a file (called a
data collector set
)
for offline analysis. The preferred mechanism on production servers is to use the file. You'll want to collect the
information in a file in order to store it and transmit it as needed over time. Plus, writing the collection to a file takes
up fewer resources than collecting it on the screen in active memory.
To run the Performance Monitor tool, execute
perfmon
from a command prompt, which will open the
Performance Monitor suite. You can also right-click the Computer icon on the desktop or the Start menu, expand
Diagnostics, and then expand the Performance Monitor. You can also go to the Start screen and start typing
Performance Monitor
; you'll see the icon for launching the application. Any of these methods will allow you to open
the Performance Monitor utility.
You will learn how to set up the individual counters Chapter 5. Now that I've introduced the concept of the
Performance Monitor, I'll introduce another metric gathering interface, dynamic management objects.