Information Technology Reference
In-Depth Information
50
55
60
65
70
75
LGAN
0
0.001
0.002
0.003
0.004
0.005
0.006
0.007
0.008
0.009
0.01
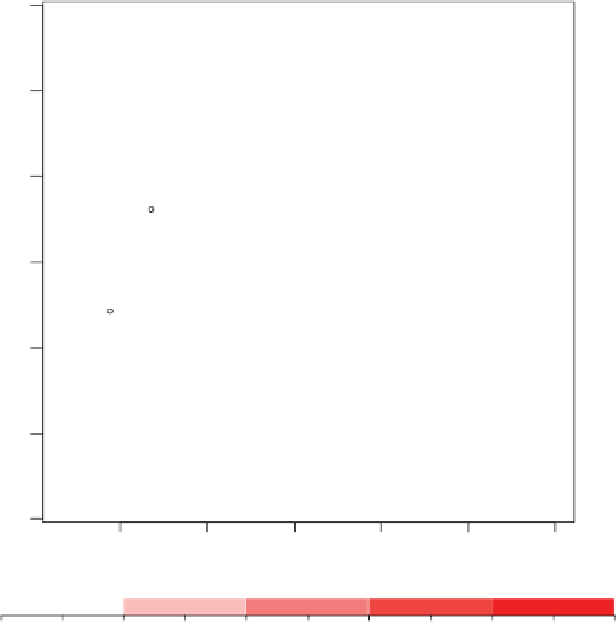
Figure 2.40
Scatterplot of two head dimensions variables data set superimposed upon
a bivariate image plot of the data. Figure constructed using function
Scatterdensity
with five contour levels.
generalizing the boxplot. The highest density region is a probability region in contrast
to the depth region defined in the construction of the bagplot. It differs from the other
bivariate boxplot generalizations in its emphasis on density. For this reason the mode,
rather than the median, is indicated. The
-bag provides a good summary of a unimodal
cloud of sample points. However, instead of generalizing the boxplot, bivariate density
estimation procedures (Scott, 1992; Venables and Ripley, 2002; Eilers and Goeman, 2004)
can also be employed to represent multimodal clouds of points. We make use of the R
function
kde2d
provided by Venables and Ripley in their package
MASS
to add a bivariate
density plot in the form of an image plot to the scatterplot of the head dimensions data
set. Figures 2.40 and 2.41 are constructed with our function
Scatterdensity
available
in
UBbipl
.
All the above methods are invariant under rotation of the two-dimensional points and
hence may be used with biplots. While
α
-bags are geared for unimodal distributions,
density plots have the advantage that they are able to show multimodal characteris-
tics of sample points in a scatterplot. However, when the sample points originate from
different subgroups, the scatterplot (or biplot) may be overlaid with
α
α
-bags for each