Information Technology Reference
In-Depth Information
LTN
135
130
125
LGAN
45
50
55
60
65
70
75
120
115
110
Female; n = 59
Male; n = 200
105
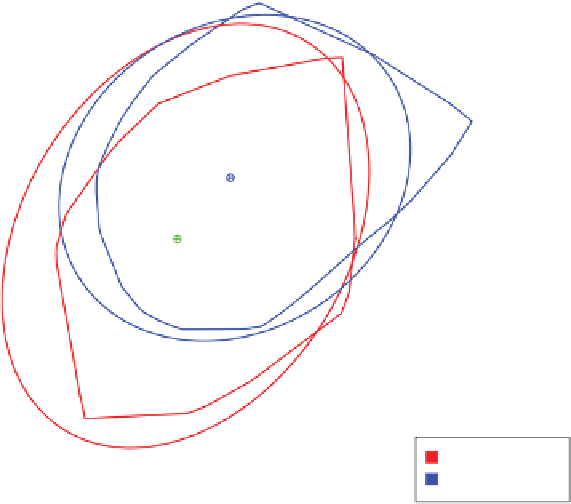
Figure 2.39
A comparison of the 0.95-bags and the 0
.
05
κ
-ellipses for the females and
males in the scatterplot of the two head dimensions variables
LTN
and
LGAN
.
The biplot functions in
UBbipl
use a default value of 2500 sample points for the
construction of the
-bags.
In Figure 2.39, we provide a comparison of 0.95-bags with 0.05
κ
-ellipses. Separate
bags and ellipses are drawn for the females and males for the two head dimensions
variables
LTN
and
LGAN
.
Typically, an
α
-bag will follow the bivariate scatter in the configuration of points
more closely than the corresponding
κ
-ellipse because of the rigid form of the latter.
This is illustrated in Figure 2.39. Note also, in the case of the females, the relatively
large areas within the 0.05-ellipse not containing any data points at all. Since an
α
-bag is drawn about the depth median of the bivariate configuration, in contrast to the
κ
-ellipse that is drawn about the bivariate centroid, deviations from bivariate symmetry
are reflected in differences in the general location of the two geometric structures.
α
2.9.5 Bivariate density plots
Other means for graphically summarizing the shape of a cloud of bivariate observations
can also be computed. Hyndman (1996) proposes the use of highest density regions in