Information Technology Reference
In-Depth Information
can be accomplished using the program
Isodepth
of Ruts and Rousseeuw (1996). The
depth contours resulting from
Isodepth
, however, do not allow for specifying the exact
proportion of bivariate data points enclosed by the contour. We propose the construction
of depth contours using the interpolation algorithms provided in the original
bagplot
function of Rousseeuw and Ruts (1997) as graphical summaries of bivariate data points.
The resulting contours will be called
α
-
bags
. The above functions have been modified
and incorporated in the R library described in this topic for constructing biplots. Instead
of finding a bag containing
n
/2 observations, the 50% cut-off is replaced by a value
α
ranging between 0 and 1.
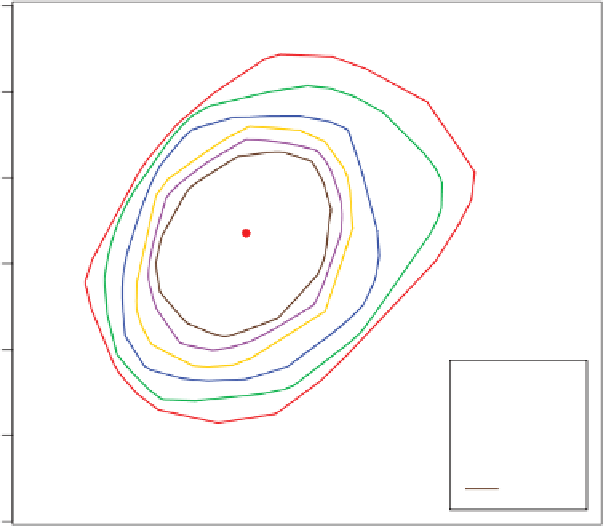
Typically, a value of 0.90 or 0.95 will be useful for enclosing a cluster of observations,
excluding the 10% or 5% of the observations at the extremes of the cluster. Comparing
the
α
-bag to depth contours or convex peeling, this method allows for controlling the
number of observations outside the enclosure. Figure 2.38, constructed using the function
Scatterplotbags
available in
UBbipl
, contains the scatterplot of the head dimensions
data with the 0.95-, 0.80-, 0.70-, 0.60- and 0.50-bags superimposed. The 0.50-bag corre-
sponds with the bag of the bagplot. Note, however, that for large data sets the 0.50-bag
and the bag of the bagplot are not identical due to the convention of using a random
subsample of observations for computing the depth median and the bag in order to speed
up the calculations.
α =
0.95
α =
0.9
α =
0.8
α =
0.7
α =
0.6
α =
0.5
45
50
55
60
65
70
75
LGAN
Figure 2.38
Scatterplot of two head dimensions variables with superimposed 0.95-,
0.90-, 0.80-, 0.70-, 0.60- and 0.50-bags. The Tukey median is shown as the red dot in
the centre.