Information Technology Reference
In-Depth Information
−
0.3
5
r
RGF
−
0.2
4
g
3
SLF
−
8
7
q
2
−
0.1
6
4
4
−
6
5
u
v
1
h
−
4
3
j
c
m
2
−
2
0
p
1
−
1
i
f
0
−
2
3
−
n
b
2
−
1
a
4
0.1
d
−
2
6
k
w
8
s
e
10
0.2
12
t
14
16
0.3
SPR
PLF
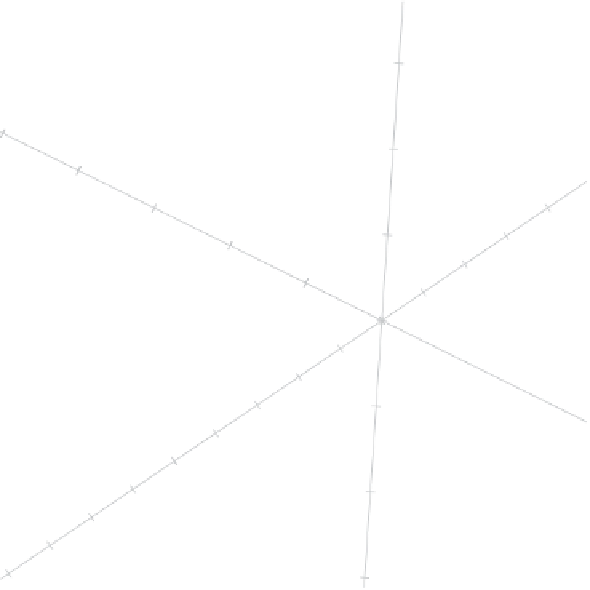
Figure 2.25
Interpolation biplot of the aircraft data with obliquely translated biplot
axes, such that the point of concurrency is zero on each axis. The original origin is
retained and marked with a black cross.
2.8 Biplots and large data sets
So far, we have used a very small data set to illustrate the essentials of constructing
biplots. Can samples and variables of large data sets also be meaningfully represented
in biplots? We first look at a moderately large data set consisting of a sample of 1135
responses to 90 questions (variables). This study was undertaken to investigate people's
attitude to buying from a mail order catalogue. The investigator separated the questions
into three components:
Q1
to
Q33
measured the reasons why people buy from mail
order catalogues;
Q34
to
Q57
measured the perceived risks involved; and
Q58
to
Q90
measured risk relievers influencing their behaviour. Each item consists of a statement
and the following six alternatives:
'agree completely', scored as 1;
'agree somewhat', scored as 2;
'agree a little', scored as 3;
'disagree a little', scored as 4;
'disagree somewhat', scored as 5;
'disagree completely', scored as 6.