Environmental Engineering Reference
In-Depth Information
The impression of sound on the human ear is a complex function of frequency
and level. Generally, the ear is most sensitive for sound pressure near 1000 Hz, while
the sensitivity decreases both to lower and higher frequencies. Experience from tests
with numerous persons has led to the well-known Fletcher-Munson curves of equal
loudness. On this basis weighting curves have been defined, called A to D. For prac-
tical use the A-weighting has become mandatory, in spite of the fact that this curve
was originally meant for lower sound pressure levels of 40 dB. Levels weighted ac-
cording to the A curve are given in dB(A).
For closer inspection, and to find single tones, sound measurements are made in
octave or third-octave frequency bands.
7.5.2 Sound Emission by WES
During operation the audible noise produced by a WES is mainly determined by the
aerodynamic sound of the blades, the principal components of which are due to the
trailing edge noise and the noise from turbulent inflow. Noise components of other
origin contribute only in a minor way. The generated noise depends on the wind
velocity in hub height, the emission generally increasing with increasing load.
Pitch-controlled systems are characterized by power-dependent noise levels be-
low rated power condition, and no further increase above rated wind velocity. On the
other hand, in stall-controlled systems the noise emission increases further beyond
rated power.
From experience it is known that the sound power level increases roughly
1-2,5 dB per increase of wind velocity by 1 m/s. under load up to rated condition,
see Fig. 7.17.
For WES acoustic noise measurement techniques are standardized in IEC 61400-
11 [IEC 61400]. Tests are made at specified wind velocities between 6 and 12 m/s,
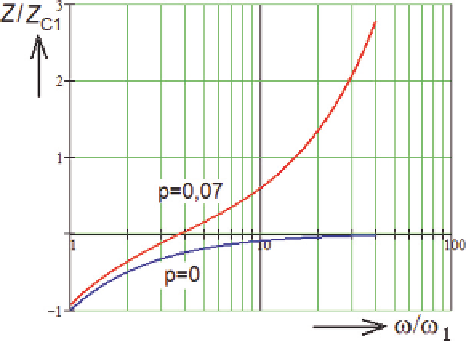
Fig. 7.17
Relative impedance of series resonant circuit
Search WWH ::

Custom Search