Environmental Engineering Reference
In-Depth Information
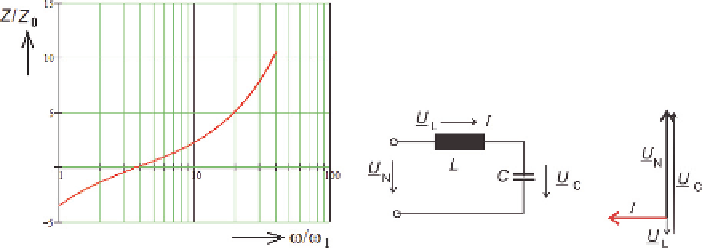
Fig. 7.16
Model of capacitive compensator with series inductor
In the example, for a required
p
= 0
,
07 and given
f
1
= 50 Hz, the inductor must
be designed for
L
10
−
6
/
C
(in H when C is in F). The frequency response
curves of the impedance referred to the capacitor impedance at
≥
70
,
92
·
ω
1
, with and without
series inductor are shown in Fig. 7.16; in the example the signal to grid frequency
ratio is
ω
1
= 15. Note that in the model resistive components are neglected, and
inductive/capacitive reactances are of positive/negative value.
ω
s
/
7.5 Noise Emission
7.5.1 General
Sources of sound produced by mechanical systems such as wind turbines are:
- aerodynamic noise,
- magnetic noise,
- noise of bearings and slip-ring/brush contacts (if applicable).
These sources contribute in different magnitudes and frequencies to the sound emis-
sion.
The physical quantities most used in acoustics are expressed in logarithmic
notation:
Sound pressure level
L
p
= 20
·
lg(
p
/
p
o
)
,
dB
10
−
5
,
Pa
with the reference
p
o
= 2
·
Sound power level
L
w
= 10
·
lg(
P
/
P
o
)
,
dB
10
−
12
W
with the reference
P
o
= 1
·
The sound power from a source can be calculated from sound pressure levels,
measured on a suitably defined surface, e.g. a half-sphere, put up above the ma-
chine under test. Test conditions and averaging procedure are specified in relevant
standards. Using the measuring surface
S
, the relevant equation is:
S
o
= 1m
2
L
w
=
L
p
+ 10 lg(
S
/
S
o
)
where
Search WWH ::

Custom Search