Database Reference
In-Depth Information
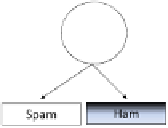
Fig. 2.3 A decision tree (decision stump) based on a vertical split.
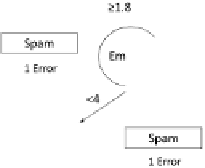
Fig. 2.4 A decision tree obtained after two splits.
Comparing the two trees reveals that the horizontal split leads to
9 misclassification errors (1 misclassification in the left leaf and 8 misclassifi-
cations in the right leaf), while the vertical split yields 15 misclassifications.
Therefore, by adopting a greedy strategy, we select the former tree and move
on to develop the tree's branches. The procedure is recursively applied to
each of the resulting branches. Namely, for each branch we try to split the
corresponding sub-sample even further as illustrated in Figure 2.4.
Note that the number of classification regions in the graph is equal to
the number of leaves in the tree. Moreover, since we are dealing with a
binary tree, the amount of internal nodes (i.e. non-leaf nodes) equals the
number of leaves minus 1.
Each node continues to branch out until we reach a sub-sample that
contains only instances from the same label, or until no further splitting is
possible. In the above spam filtering example, the process continues until
the graph in Figure 2.5 is reached. Note that there are nine regions in this
graph. Each region consists of instances of only one label. Namely, there
are no misclassification errors in regard to the training set. However, the


Search WWH ::

Custom Search