Biology Reference
In-Depth Information
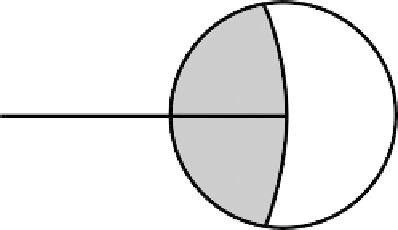
FIGURE 10.9
The line joining a species' mean to the
grand mean; random variation in the position of the
mean only rarely lies along the line within the shaded
region. Changes in the position of shapes orthogonal to
that line or within the unshaded region increase the dis-
tance to the mean.
Y
X
D
Grand
mean
Species'
mean
We can construct confidence intervals and standard errors for
MD
by bootstrapping.
When we need to take the uncertainty of the regression into account, we first fit a regres-
sion model to the data, determine the residuals, predict the shape expected for each size,
bootstrap the residuals and randomly allocate them to each predicted shape, then refit the
regression model to the data to generate a standardized data set for the bootstrap set. This
is iterated
N
times (where
N
is the number of bootstrap sets). If we do not need to take the
uncertainty of the regression into account, we simply resample (with replacement) from
each of the samples. For each bootstrap set of standardized values, we calculate the dispar-
ity of that sample using the formula for
MD
above. In the case of the adult piranhas
discussed above, the estimate of
MD
0.00398; the 95th percentile over the bootstrap sets
gives us the two-tailed confidence interval on that estimate, 0.00377 to 0.00440.
We still do not know if that value is large or small because we have still not compared
it to the disparity of anything else. We will thus continue the analysis, comparing the
levels of adult disparity to that of juveniles, and comparing the disparities of several
piranha clades (
Figure 10.10
).
Table 10.1
gives the disparities (
MD
) of juvenile and adult
shapes, as well as the standard errors (
SE
) for the estimates. We can use a
t
-test to deter-
mine whether derived traits like mean disparities are significantly different:
5
MD
2
ðN
1
2
MD
1
2
r
t
(10.4)
5
1
ÞN
1
SE
1
1
ðN
2
2
1
ÞN
2
SE
2
N
1
1
N
2
N
1
N
2
N
1
1
N
2
2
2
with (
N
1
1
2) degrees of freedom. Because
MD
is computed from the mean shapes of
species,
N
1
and
N
2
are the numbers of species in the respective clades. We can also use a
bootstrap procedure like that used to test whether two Procrustes distances are different.
We begin by computing the disparities of the two groups and the difference between those
disparities, and then we resample each data set with replacement, repeating the calcula-
tions of the disparities and the difference between them. After a sufficient number of boot-
straps, we can determine the 95% interval for the range of differences. If this range
excludes zero, we can conclude that the observed difference is significant at the 95% level.
For the most inclusive piranha group (Clade 1), disparity decreases significantly over
ontogeny, as it does in Clade 2. In Clade 3, disparity increases statistically significantly,
but the change is slight
in contrast to the dramatic increase in Clade 4. In Clades 5 and
6, disparity is constant throughout ontogeny. A perhaps counterintuitive result is that
adult disparities of Clades 3 and 4 are significantly greater than that of the group as a
N
2
2