Environmental Engineering Reference
In-Depth Information
1000
1000
0
0
200
300
1000
0
1000
1000
0
0
1000
1000
175
0
0
1000
1000
150
0
0
1000
1000
0
0
1000
100
1000
600
0
0
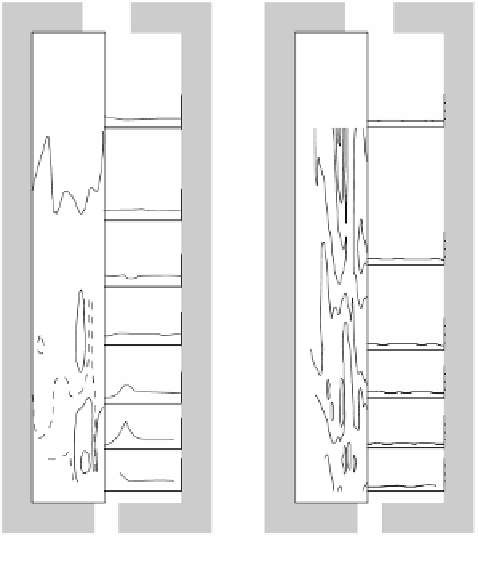
COAL Flame
HFO Flame
occurs at 10 to 15 cm from the coal injection. The strongest gradient in the temper-
ature profile was found in that region at the first (15 cm) and second (43 cm)
measured traverses.
At the first traverse the “lowest temperature” (1250˚C) was measured and at the
second traverse the peak temperature was 1497˚C. The peak flame temperature is
150˚C higher than the preheated temperature of the comburent. In this region the
most intense combustion takes place.
2.5.3.4.4 Velocity Measurements
Figure 2.109
shows the velocity contour and profiles in the furnace. At the first three
measured traverses both the comburent and coal jets are clearly visible. The strong
central air jet enters the furnace with a high velocity of ~65 m/s.
The central jet is mainly producing the flow pattern in the furnace. The jet is
expanding and it builds a large recirculation zone. The coal jets enter the furnace
in the recirculation zone of the central air jet with a velocity of 26 m/s. They are
no longer distinguishable from the central jet after the third traverse.
The measured peak velocity in the central air is lower than the expected velocity.
The peak measured velocity is on traverse 2 (47 m/s); on the first traverse the highest
measured velocity is 42 m/s. In the first and second traverses, a velocity very close
to the inlet one (65 m/s) was expected. According to the free jet theory in the second
and third traverses the jet is in the potential core region (
x
/
d
= 1.2 and 3.4, respec-


Search WWH ::

Custom Search