Environmental Engineering Reference
In-Depth Information
2
5
0
0
5
2
5
0
0
5
2
0.25
0
0
2
0.50
5
0
2
0.25
0
5
0
2
0.25
5
3
0
0
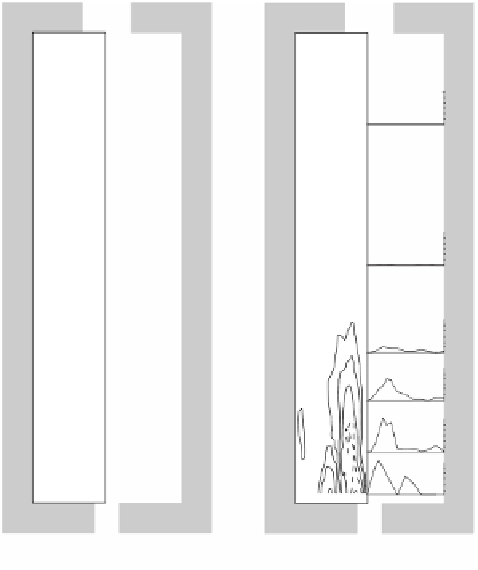
COAL Flame
HFO Flame
FIGURE 2.105
Carbon monoxide concentration (Vol%, dry).
larger flame volume. The highest input velocity of the fuel jets may explain this
difference. The NG jets had an input velocity of 100 m/s. Because of the higher
momentum of the jets, the entrainment of recirculation products before mixing
with the combustion air is higher for the NG and LFO flames.
Farther downstream the profile is flatter and closer to the outlet value.
Unburned hydrocarbons —
No high C
n
H
m
concentration was measured in the
coal flame
(
Figure 2.107
)
. The peak concentration of 1520 ppm was measured in
the second traverse. No C
n
H
m
w
as found at the chimney. In the HFO flame the C
n
H
m
concentrations have a similar profile but much higher values (as can be seen in
2.5.3.4.3 Temperature Measurements
Figure 2.108
shows the temperature contour and profile in the furnace for the coal
flame (on the left side) and for the HFO flame (on the right side). The temperature
field in the coal flame is uniform almost in the entire furnace and is similar to the
NG and oil flames. The whole furnace is filled with combustion products at tem-
peratures in the range of 1350 to 1500˚C.
Temperature gradients were measured only in the coal jets at the first two
traverses. The coal jets are immersed into hot combustion products and this produces
a very fast heat up and devolatilization of the coal particles. The visible ignition


Search WWH ::

Custom Search