Databases Reference
In-Depth Information
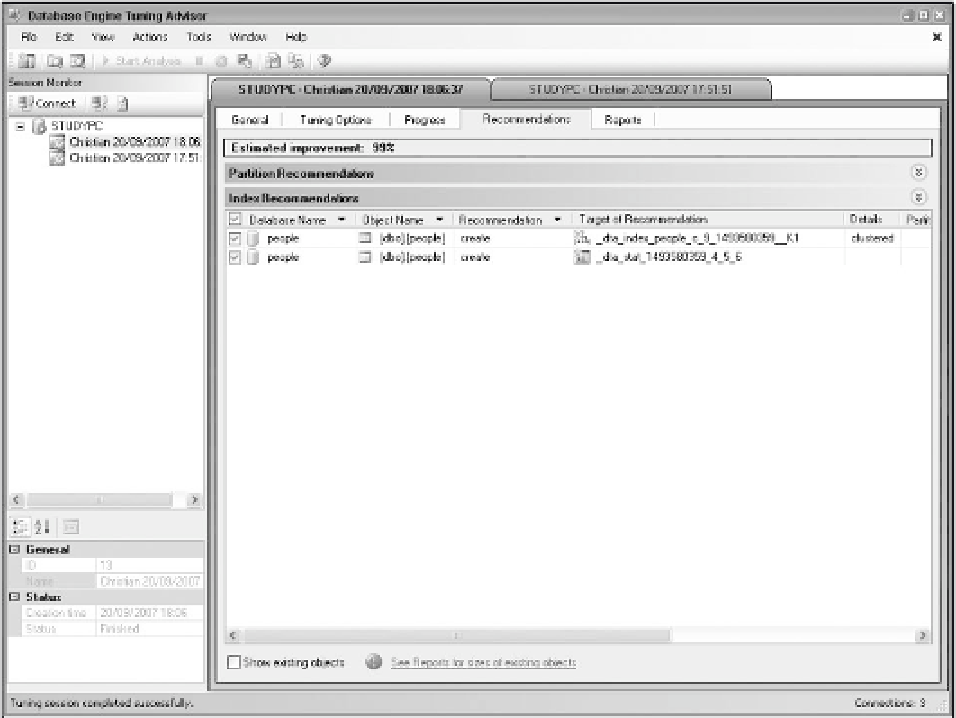
Now you can start the Analysis session again and see what results DTA has for you this time. You can
see those results in Figure 11-7.
Figure 11-7
This time DTA has two recommendations and reckons it can improve things by 99 percent. Take a closer
look at what you can do with these recommendations. To do this, just scroll the recommendations win-
dow way over to the right to find the
Definition
column. If you hover over this, a tooltip pops up telling
you to click on the link to get a T-SQL script of the recommendations. Doing so will reveal a script like
that shown in Figure 11-8.
You can now either copy this script to the clipboard and from there into a file or directly into SQL Server
Management Studio to be executed. Alternatively, after taking a look at the recommendations, you can
have DTA run them for you by selecting Apply Recommendations from the Actions Menu.
Before doing that, take a look at some of the other information in the Reports tab. This area of DTA holds
a lot of useful information about what DTA did and why. In the simple case you have been working with
here, most of the interesting information is on the Statement cost reports. Start with the first report in the
list, shown in Figure 11-9.
This shows the various statements in the workload and the estimated improvement that DTA expects
to come from the recommendation. In this case, the improvement all comes from the
update
statement,
which the tuning report believes will be improved by 99.90 percent.


Search WWH ::

Custom Search