Databases Reference
In-Depth Information
Now see what DTA has to say about this workload. This time you'll see how to run DTA against a
workload. The next step is to set up SQL Server Profiler to capture a trace file, which is covered in Chapter
5. The key things you need to remember when setting up SQL Server Profiler for this trace are twofold:
use the tuning template and ensure that the files are set to rollover, although the overall file size will be
trivial.
Once Profiler is set up and the trace is running, execute the
usp_marriageUpdate
stored procedure once
and then stop the trace, which saves the file. Now you have a workload trace file on disk, and you can
start DTA and use it to tune the workload. Launch DTA and connect to your SQL Server. If you have
been following the earlier sections, you will see the earlier trace sessions in the left hand pane of DTA, as
shown in Figure 11-5.
This is another part of DTA that is worth briefly mentioning. Each of your tuning sessions is saved, so
you can go back and review what you asked DTA to tune and the recommendations DTA came up with.
However, if you just use the default session names, as you have been doing, then the tuning session
names don't really have a lot of meaning and pretty soon it's difficult to know what each session was for.
Therefore, you should come up with a naming scheme that makes sense to you. This will help you find
the session you're looking for in the future.
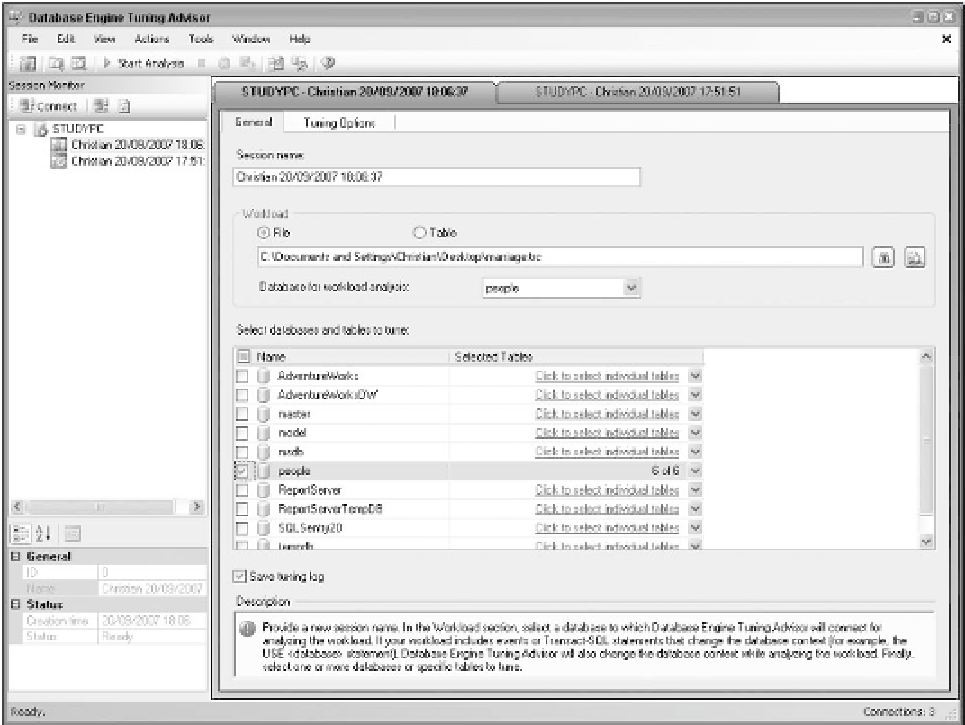
After setting the database to
People
in both the drop-down selection and the list of databases to tune,
you need to tell DTA that you want to tune a file and where the file is. Either type in the file name and
full path or use the browse button to select the trace file you just created, as shown in Figure 11-6.
Figure 11-6


Search WWH ::

Custom Search