Databases Reference
In-Depth Information
SQL Profiler TSQL_Replay template is specifically designed for collecting all necessary trace events so
that it guarantees trace output data will be able to replay from SQL Profiler. You can use all trace events
in the TSQL_Replay template as a starting point for the baseline workload configuration. In addition to all
the columns defined in the replay template, the following columns are useful for performance analysis:
❑
RPC:Completed event:
Add TextData, CPU, Duration, Reads, and Writes columns.
❑
SQL:BatchCompleted event:
Add CPU, Duration, Reads, and Writes columns.
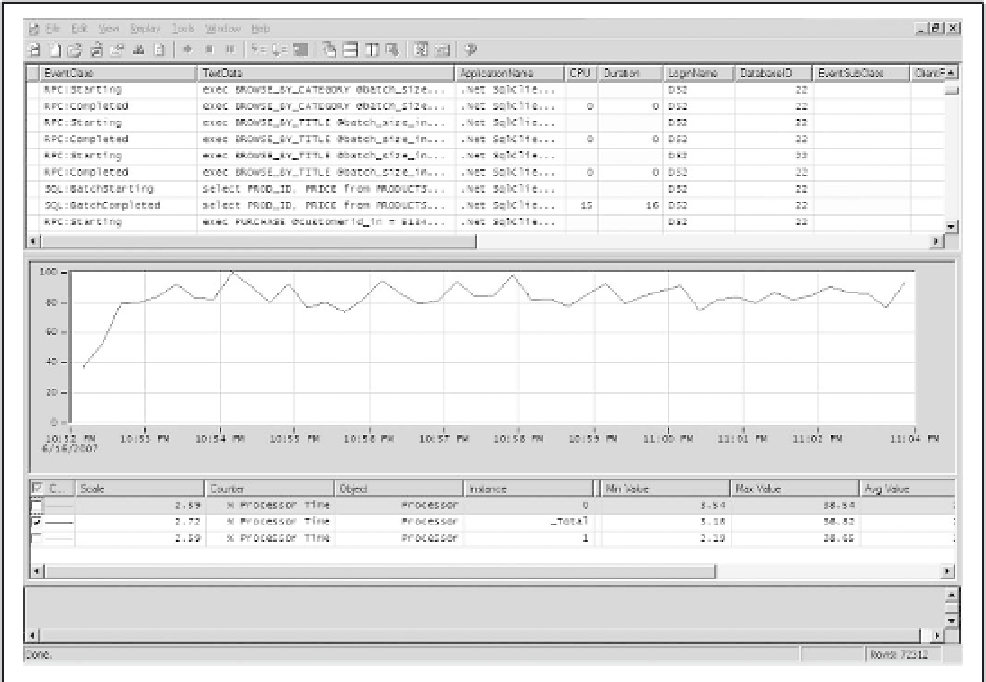
SQL Profiler provides a quick way to visualize overall database transaction distributions over a 24-hour
time period when combining a full day's workload with the system performance data. Refer to the
example in Figure 10-1.
SpecificPerformanceTuning
Most often, you collect SQL database trace events when troubleshooting a specific issue or making
improvements to a specific database object. For troubleshooting and performance tuning, samples might
be taken from a specific database object, a database, a user, or a connecting server.
Some database administrators like to collect a single full workload for a long period so as not to miss any
critical events; others like to collect very specific trace events for a narrower period. The best practice is
to minimize system resource impact and catch trace events at the right time. Some best practices were
covered in Chapter 5.
Figure 10-2


Search WWH ::

Custom Search