Databases Reference
In-Depth Information
disabling parallelism doesn't tackle the root cause, but it does bring the system back to a usable state for
a more leisurely investigation of the parallel query.
However, for our scenario we know where the parallel execution is coming from, so we can tackle it
directly. Run this script again to re-enable parallelism:
SP_CONFIGURE 'max degree of parallelism', 0
GO
RECONFIGURE
We do this so we know that SQL Server is
choosing
not to do a parallel execution instead of preventing it.
There is a table scan in the execution plan, which is bad because it means that it has to read all the rows
in the table. You can see in Figure 4-7 that the estimated number of rows returned is 1. On a 250,000 row
table, this is just crying out for a visit to Chapter 11 to read about indexing, but as a quick fix let's just
add a non-clustered index to the column we're searching on — people.personId:
CREATE NONCLUSTERED INDEX idx_personID
ON people(personID)
After running the workload script again:
waitType waitingTasks waitTimeMs maxWaitTimeMs signalWaitTimeMs
---------------- ------------ ---------- ------------- ----------------
WRITELOG
11799
81136
655
5288
PAGEIOLATCH_UP
1803
15272
546
31
SOS_SCHEDULER_YIELD
276910
6505
171
6396
session_id cpu_time total_elapsed_time
---------- ----------- ------------------
52
831829
991306 (16:36)
You can see a dramatic overall improvement with a significant reduction in CPU time and WRITELOG
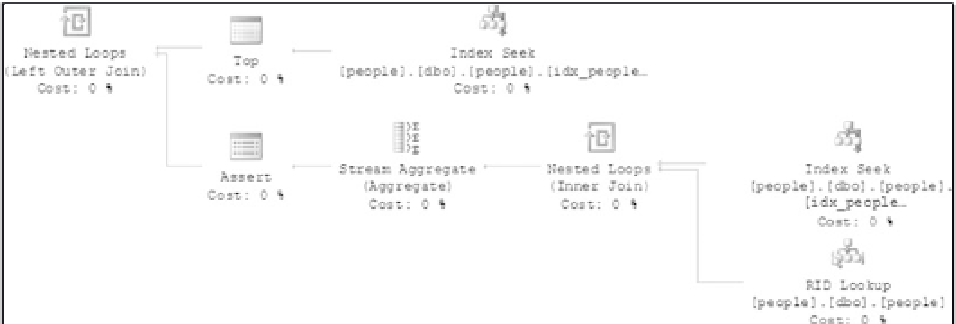
is now the top wait with PAGEIOLATCH_UP in second place. You can look at the execution plan in
Figure 4-8 and see that the table scans are now index seeks, which accounts for the dramatic increase
in performance to 16 minutes 36 seconds. There could still be some CPU time reduction to be had by
looking at indexes thoroughly by following Chapter 11, but the top bottleneck points to the transaction
log, so we're going to look at that first.
Figure 4-8


Search WWH ::

Custom Search