Databases Reference
In-Depth Information
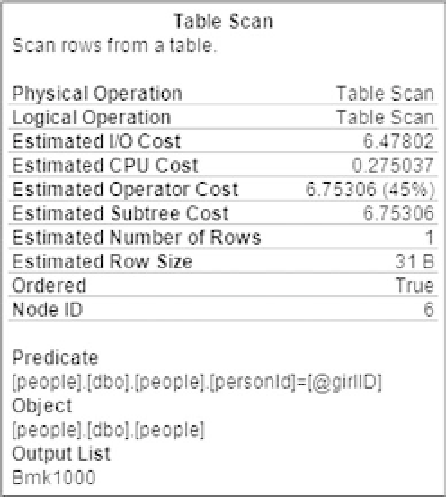
Figure 4-7
First, try disabling parallelism by running:
sp_configure 'max degree of parallelism', 1
go
reconfigure
The query results (edited for relevance) are:
waitType waitingTasks waitTimeMs maxWaitTimeMs signalWaitTimeMs
---------------- ------------ ---------- ------------- ----------------
WRITELOG
12416
71261
702
9032
PAGEIOLATCH_UP
2423
19812
327
124
SOS_SCHEDULER_YIELD
747994
19032
967
18595
PAGEIOLATCH_SH
74
4087
452
31
session_id cpu_time total_elapsed_time
---------- ----------- ------------------
52
2583595
2786682 (46:33)
TheCXPACKETwaitisgone,soyou'renotusingparallel queries any more. You now have WRITELOG
as the top wait, which means that the transaction log file is now the top bottleneck. The total elapsed time
has jumped from 40 minutes 21 seconds to 46 minutes 33 seconds, and the signal waits still indicate a
concern for CPU time. Simply disabling parallelism or even reducing max degree of parallelism to half
the number of processors is a quick and effective way to reduce an overall CPU bottleneck at the expense
of a longer execution time.
We've been called out to Microsoft customer sites with a ''Severity A - Server Down'' support case (what
we call a critsit) where all the CPUs are running at 100 percent in a large OLTP system to fulfil a parallel
execution. The server cannot serve any other requests so in effect the system is down. In that situation


Search WWH ::

Custom Search