Environmental Engineering Reference
In-Depth Information
10
0
10
-1
10
-2
10
-3
10
-4
10
-5
10
-6
10
-7
10
-8
10
-9
12
13
14
15
16
17
18
19
20
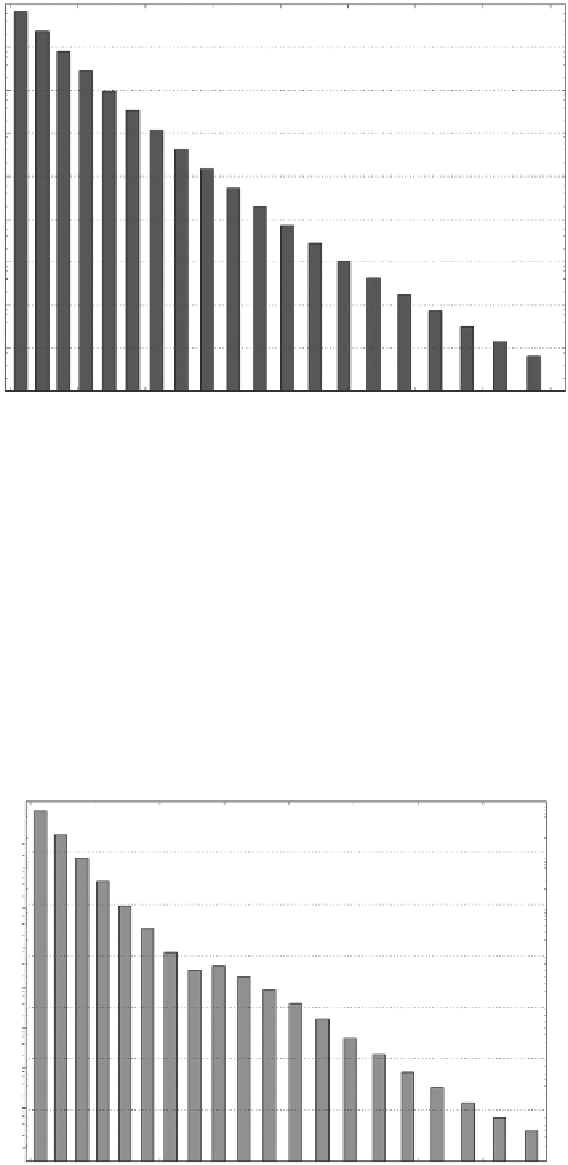
Maximum water level in the reservoir (m)
Figure 11.23
Occurrence probability of the 20 intervals obtained with software iPresas Calc.
Figure 11.24
shows resulting annual failure probabilities from each water level interval.
Adding the annual failure probability of all the intervals yields the annual failure prob-
ability for the dam. In this example, the annual failure probability for the dam is 0.01001.
The annual failure probability obtained above is influenced by the relatively low number
of simulations. When the calculations are repeated for an average fragility curve based on
10,000 simulations, the estimated APF decreases to 0.00509. This reduction suggests the
need of performing at least one more set of calculations, that is, with 100,000 samples, to
check if the calculated value of the annualized probability of failure fully stabilizes.
The current state of the practice in dam safety engineering consists of obtaining results in
terms of APF using the average fragility curve, as done in the example above, which captures
10
-2
10
-3
10
-4
10
-5
10
-6
10
-7
10
-8
10
-9
12
13
14
15
16
17
18
19
Maximum water level in the reservoir (m)
Figure 11.24
Annual failure probability of the 20 intervals obtained with software iPresas Calc.
Search WWH ::

Custom Search