Environmental Engineering Reference
In-Depth Information
As shown in
Figure 11.21
,
exceedance probability curves are usually discretized in several
intervals in order to obtain a representative value (usually the average) and an occurrence
probability value for each interval subsequently used to compute the total failure probabil-
ity. The probability of occurrence of each load interval is estimated using the probability
mass function, considering pool levels as a discrete variable, as shown in
Equation 11.14
.
p
=−
P
P
(11.14)
Oi
Li
Ui
where p
Oi
is the occurrence probability on interval i, P
Li
is the AEP of the lower bound of the
interval i, and P
Ui
is the AEP of the upper bound of the interval i.
The failure probability for each interval is obtained multiplying the occurrence probabil-
ity of each interval (p
Oi
) by the conditional failure probability of the interval's representative
value (p
Ci
). This conditional failure probability value is obtained directly from the fragility
curve. Adding the failure probability of all the intervals examined yields the total failure
probability of the structure. The higher the number of intervals, the more accurate the
results will be.
To obtain the annual failure probabilities, the average fragility curve from the previous
section is combined with the exceedance probability of pool levels for the dam in the exam-
ple. This combination has been made with a simple risk model elaborated using the iPresas
Calc software (
www. ipresas. com
).
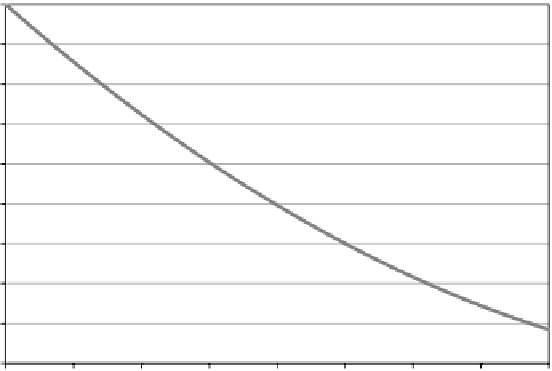
The AEP of maximum pool levels used for the reservoir in the example is shown in
Figure
vals, each interval creates a branch of the event tree for this risk model. The occurrence
probability of each interval is estimated as shown in
Equation 11.14
.
Figure 11.23
shows the
resulting occurrence probability results of each pool level interval.
The occurrence probability of each interval
(
Equation 11.14
)
is multiplied by the condi-
tional probability of failure corresponding to the average water level of the interval. This
conditional probability is obtained using the average fragility curve obtained in the previous
section
(
Figure 11.15
)
.
1.E+00
1.E-01
1.E-02
1.E-03
1.E-04
1.E-05
1.E-06
1.E-07
1.E-08
1.E-09
12
13
14
15
16
17
18
19
20
Maximum water level in the reservoir (m)
Figure 11.22
Exceedance probability of maximum pool levels in the reservoir of the example.
Search WWH ::

Custom Search