Environmental Engineering Reference
In-Depth Information
100%
90%
80%
70%
60%
50%
40%
30%
20%
10%
0%
12
14
16
18
20
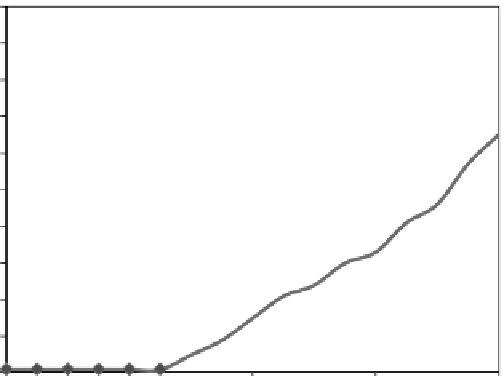
Water level in the reservoir (m)
Figure 11.15
“Average” fragility curve capturing natural variability.
•
Step 7.
100 different pairs of values for friction angle and cohesion have been sampled
from the epistemic uncertainty distributions using Monte Carlo. Each pair of values
obtained has been used as new “averages” to sample 100 new pair of values from
the natural uncertainty distribution, which is supposed to remain constant. In total,
10,000 pairs of values (100 × 100) of the friction angle and cohesion are thus sampled.
These values have been used to compute 100 different fragility curves as explained in
the previous step. Results are shown in
Figure 11.16
.
•
Step 8.
As it can be observed, the fragility curves obtained in this first attempt show
probability ranges from 0 to 100% for almost the full range of water pool levels, which
can be due to the estimated epistemic uncertainty.
When such a dispersion of results is obtained, it is worth analyzing the impact of each
random variable separately, so that a thorough review of the implications of the selected
100.0%
Average curve
Crest level
M.O.L.
80.0%
60.0%
40.0%
20.0%
0.0%
12
13
14
15
16
17
18
19
20
Maximum water level in the reservoir (m)
Figure 11.16
Fragility curves obtained with friction and cohesion as random variables.


Search WWH ::

Custom Search