Environmental Engineering Reference
In-Depth Information
100.0%
Average curve
Crest level
M.O.L.
80.0%
60.0%
40.0%
20.0%
0.0%
12
13
14
15
16
17
18
19
20
Maximum water level in the reservoir (m)
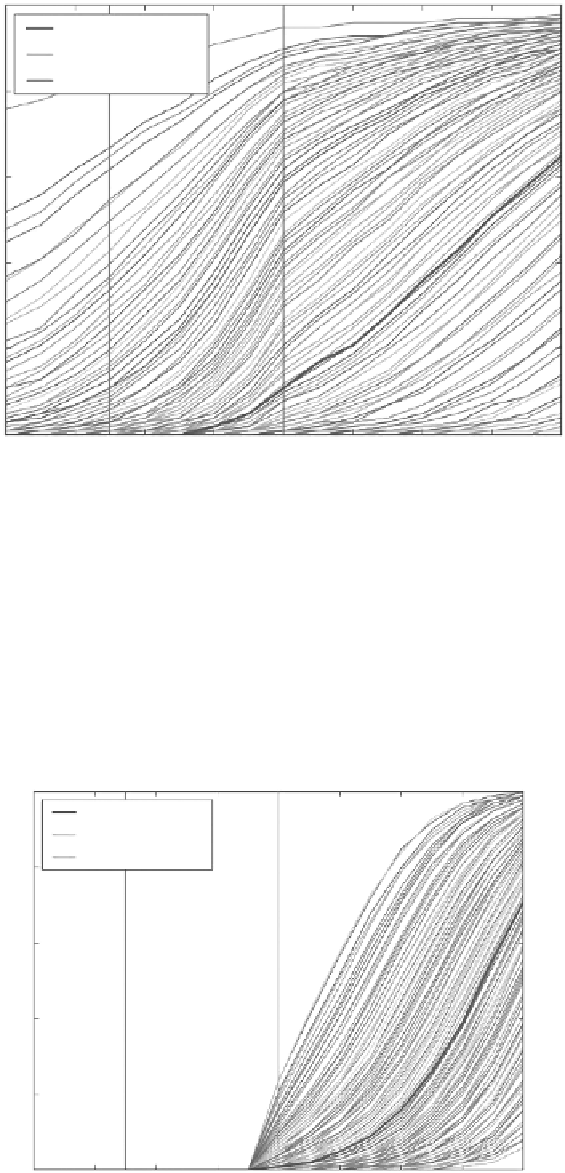
Figure 11.17
Fragility curves obtained with only cohesion as a random variable.
probability distributions can be done. As shown in
Figures 11.17
and
11.18
,
the full process
has been repeated considering first cohesion as the only random variable (with friction angle
fixed to its average value), and then friction as the only random variable (with cohesion fixed
to its average value), and keeping all the other conditions unchanged.
Considering only friction or cohesion, separately, as random variables, it can be observed
that the inherent uncertainty in cohesion has more influence than the friction in the disper-
sion of the results.
100.0%
Average curve
Crest level
M.O.L.
80.0%
60.0%
40.0%
20.0%
0.0%
12
13
14
15
16
17
18
19
20
Maximum water level in the reservoir (m)
Figure 11.18
Fragility curves obtained with only friction as a random variable.
Search WWH ::

Custom Search