Biology Reference
In-Depth Information
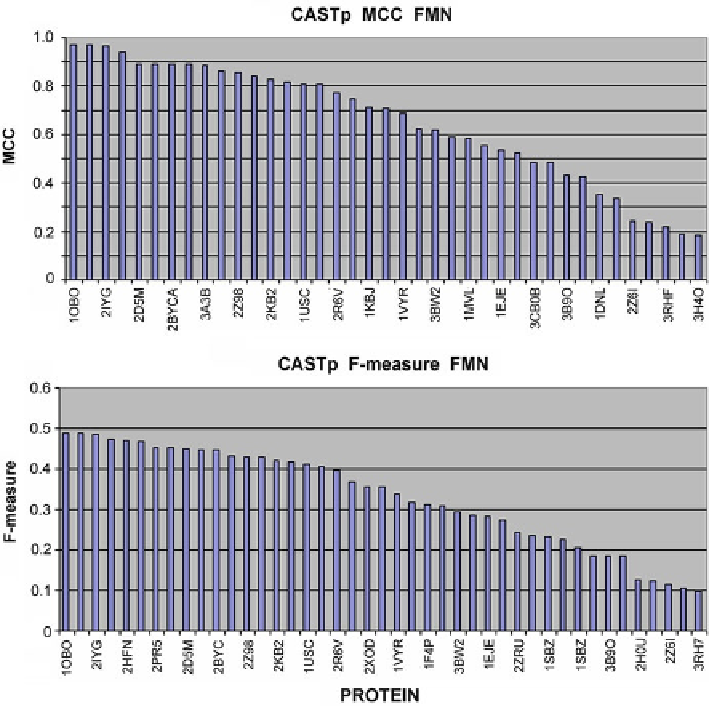
Fig. 4.7
Comparison of MCC and F-measure results for FMN-complexing proteins as reported by
CASTp
4.5.3
Properties of Target Proteins
Further analysis of the presented results suggests that proteins can be divided into
“easy” and “difficult” from the point of view of identifying binding pockets. In order
to visualize the aggregate scores, we have compared 10 proteins for which each program
reported (respectively) best- and worst-case results. This comparison is presented in
Table
4.1
and in Figs
4.13
and
4.14
. Unique matches, i.e. proteins for which binding
pockets were correctly identified only by a single program (corresponding to place-
ment in the top 10 results on a given list), have been highlighted.
Comparing Figs.
4.13
and
4.14
reveals differences with respect to the protein
being considered as well as the applied computational model. Even though all of the
proteins on each list belong to the “top 10” group, their corresponding MCC and
F-measure scores are quite varied.
Search WWH ::

Custom Search