Biology Reference
In-Depth Information
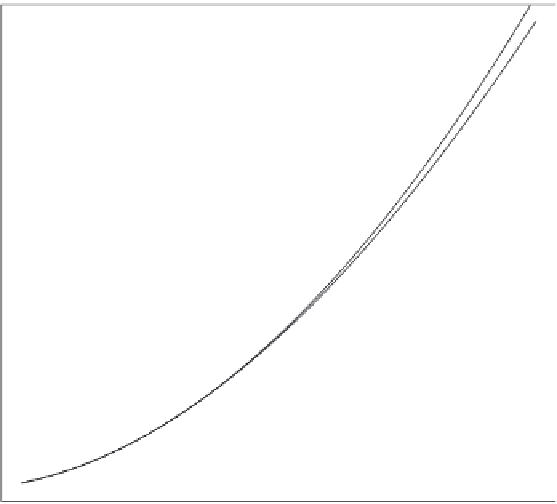
FIGURE 11.10
Plot of
age estimates against femur
lengths. The individual
points are shown at centi-
meter intervals of femoral
lengths from 8 to 20 cm and
at millimeter intervals from
20 to 40 cm. There is one
solid line shown that passes
entirely through the points
and is from a fractional
polynomial fit. The addi-
tional line that departs from
the points at greater femur
lengths is from solving the
regression of femur length
on age.
10
15
20
25
30
35
40
Femur Length (cm)
Figure 11.10
. These two lines are very similar, because the majority of information on age is
coming from the femur length. However, the line from inverting the Maresh equation
departs at longer femoral lengths because the prior density (f
ðtjlÞ
) provides relatively little
information at later ages.
Obtaining simple point estimates for individual ages-at-death ignores the fact that these
ages are not precisely known, but are instead estimated with some uncertainty. We can,
and should, recover the uncertainty in these age estimates. In place of Equation
11.20
we
can write the density function for age-at-death as
f
ðagejFL; lÞ¼
fðFLjageÞ
f
ðagejlÞ
Z
u
;
(11.21)
fðFLjtÞ
f
ðtjlÞ
t ¼0
where
represents the maximum age we are willing to consider. The variance of age-at-
death given a femur length (and the estimated exponential hazard parameter) can be found
numerically as
u
Z
u
f
ðtjFL; lÞðt mÞ
2
;
(11.22)
t ¼0