Biomedical Engineering Reference
In-Depth Information
15
10
5
20
40
60
80
100
Diameter [nm]
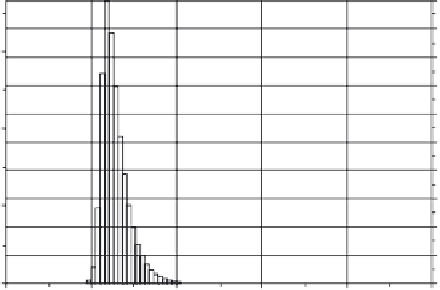
FIGURE 1.3
Analytical ultracentrifugation analysis of silica nanoparticles (NanoGEM.
SiO
2
.FITC).
Number
Volume
Intensity
1
1
1000
1000000
1
1
5
50
5
50
5
50
Diameter [nm]
Diameter [nm]
Diameter [nm]
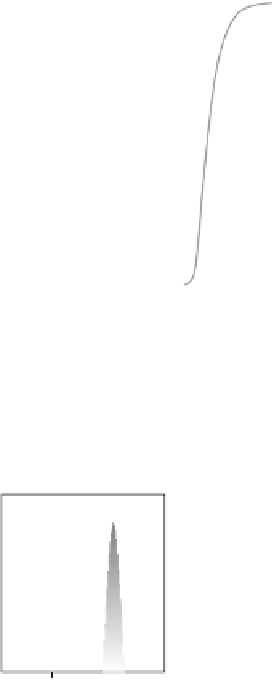
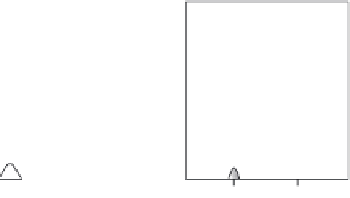
FIGURE 1.4
Number, volume, and intensity size distribution of nanoparticles determined
by dynamic light scattering (DLS). (Based on Malvern Instruments (2012). A basic guide
to particle characterization. Malvern Instruments Limited, UK. Retrieved from http://www.
atascientific.com.au/publications/wp-content/uploads/2012/07/MRK1806-01-basic-guide-
to-particle-characterisation.pdf.)
distribution is intermediate between the two. The area of the peak for the 50 nm
particles is 1000 times larger than the area of the peak for the 5 nm particles (the
volume of the 50 nm particle is 1000 times larger than the volume of the 5 nm
pa r ticle).
In many cases, the measurements of particle size and size distribution, directly
in a stock dispersion, may not be possible to perform (e.g., too high concentration
of particles). When other solvents are used to prepare working suspensions, the
exact composition of the solvents, pH, and temperature should be reported, as this
may affect the obtained results. Methods of sample dispersion, such as stirring or


Search WWH ::

Custom Search