Biomedical Engineering Reference
In-Depth Information
200
20 nm
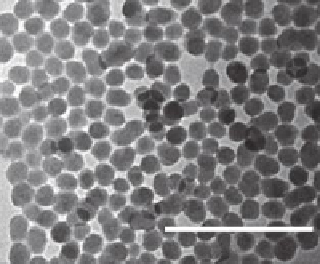
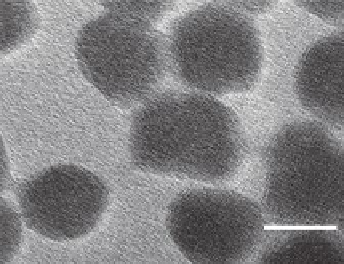
FIGURE 1.1
Transmission electron microscope (TEM) images of silica nanoparticles
(NanoGEM.SiO
2
.FITC).
15
10
5
5
10
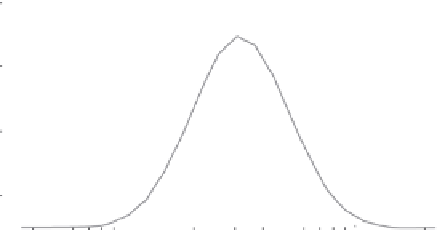
50
Diameter [nm]
100
FIGURE 1.2
Intensity size distribution of silica nanoparticles (NanoGEM.SiO
2
.FITC) ana-
lyzed by dynamic light scattering (DLS).
of particle size depends on Stokes' law (Batchelor 1967, 233). This method involves
fewer artifacts and possible errors than integral methods such as DLS. However, the
measuring concentration is very low and therefore significant dilution is necessary
(see Figure 1.3).
It has to be noted that when comparing the particle size of the same sample mea-
sured by different techniques, it is important to report what type of distribution is
being measured. Different types give different results, which is illustrated in the
DLS example (Figure 1.4).
For a mixture of particles with sizes of 5 and 50 nm the number weighted dis-
tribution gives equal values to both of them, emphasizing the presence of the 5 nm
particles, whereas the intensity weighted distribution has a signal one million
times higher for the 50 nm particles. This is caused by the phenomenon that large
particles scatter more light than small particles (the intensity of scattering of a
particle is proportional to the sixth power of its diameter). The volume-weighted


Search WWH ::

Custom Search