Biomedical Engineering Reference
In-Depth Information
45
40
Quantity of particles
35
Mass [µg × 10
-5
]
Volume [nL × 10
-6
]
BET [mm
2
]
30
25
20
15
10
5
0
1
11
21
31
41
51
61
71 81
Time [min]
91
101 111 121 131
141 151
161
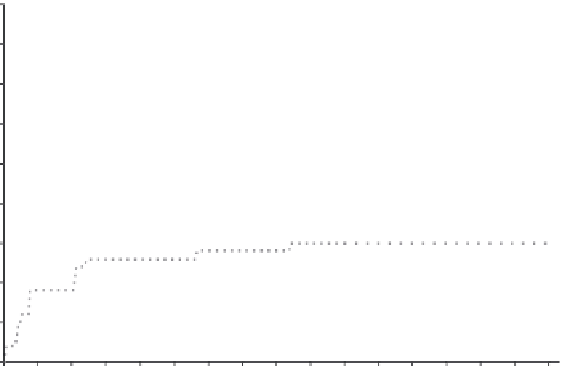
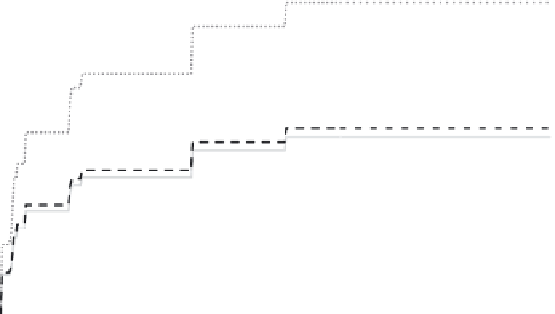
FIGURE 7.11
Uptake of AlOOH (45 µg/mL) particles by a NR8383 macrophage and calcu-
lated conversion into mass, volume, and BET surface. Results are based on particle numbers
counted by the program AM Tracking. Density and BET surface of AlOOH nanoparticles
were 2.85 g/cm
3
and 105 m
2
/g, respectively (Pauluhn 2009). Particle count (
); mass (
);
volume (
); and BET surface (
).
TABLE 7.2
Uptake of AlOOH and CeO
2
NP Agglomerates by NR8383 Alveolar Cells
Conc.
µg/mL
n
C
(max)
n
P
(max)
n
C
(final)
n
P
(final)
q
t
Particle
n
SD
q
SD
t
AlOOH
11.25
7
11
8
11
8
0.0045
0.000117
51
1.328
AlOOH
22.50
10
23
16
23
15
0.0230
0.000667
176
5.087
AlOOH
45.00
8
62
48
62
48
0.0350
0.000735
309
6.521
AlOOH
90.00
6
133
114
133
114
0.0500
0.002400
542
26.001
CeO
2
22.50
7
33
23
31
23
0.0300
0.001050
255
8.960
CeO
2
45.00
5
125
113
93
95
0.1400
0.003640
833
21.843
CeO
2
90.00
6
123
113
76
103
0.1350
0.005130
987
37.711
Note:
Maximum (max) and final number of particles after 83 min.
Abbreviations:
n
, number of experiments;
N
C
, control ROIs;
N
P
, active ROIs;
q
and
t
, mean values of
sedimentation parameters; SD, standard deviation.
The automated method for the analysis and interpretation of phagocytosis was
then applied to a concentration series of AlOOH and CeO
2
NP. Table 7.2 shows
average values from 5 to 10 experiments. The observation period was limited to
83 min for technical reasons, such that the sedimentation had not finished in some
cases. As all ROIs had the same size counting results were directly comparable. It


Search WWH ::

Custom Search