Biomedical Engineering Reference
In-Depth Information
7.3.2.4 Experimental Data of Particle Uptake
In this chapter, we describe in vitro experiments carried out with AlOOH and CeO
2
particles applied to macrophage cultures, using the software and counting algorithms
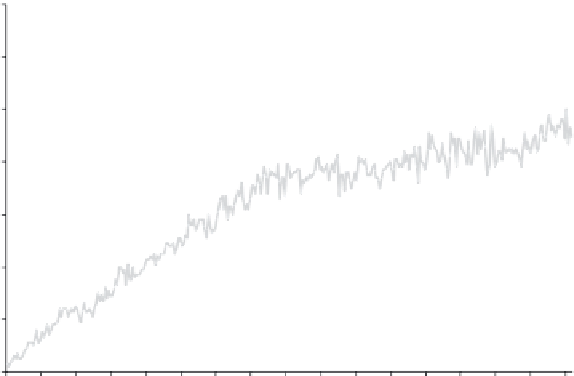
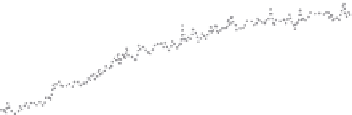
previously developed with simulated data. As is shown in the upper two curves of
Figure 7.10, the program gives the counting results for control and active ROIs.
Furthermore, the total particle number of an active ROI can be displayed, if par-
ticles concealed by the macrophage were calculated: Assuming normally distributed
particles, the program uses the mean particle counts of the control region but adapts
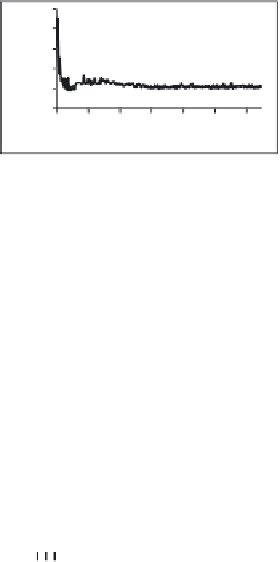
that value to the size of the macrophage (Figure 7.10, lower curve). Changes in the
mean size of sedimented particles is also indicated (Figure 7.10, inset). This option
not only allows us to demonstrate some inhomogeneity of a particle population in
the course of an experiment but furthermore shows that larger particles appear early
in the optical plane and, therefore, may dominate biologic effects. This is of pivotal
importance if mixed populations of nanoscaled and microscaled particles are being
investigated.
Based on the number of phagocytized particles and on their 2-dimensional
dimension (projected size) the program calculated mass, volume, and BET surface
of particles ingested by a macrophage. This, however, required the manual input into
the program of: (a) initial particle concentration, (b) particle density, (c) particles
BET value, (d) pixel size, and (e) the filling height of the vessel. A typical result is
shown in Figure 7.11.
140
250
200
150
100
50
0
120
100
1 1
101 151 201
Time [min]
251
301
80
60
40
20
0
1
11
21
31
41
51
61
71 81 91
Time [min]
101 111 121
131 141 151
161
FIGURE 7.10
Measurement of particle uptake by a NR8383 macrophage treated with
AlOOH nanoparticles (45 µg/mL). The ordinate gives the value for the number of visible par-
ticle agglomerates in the control region ( ), the calculated density of particles within the
macrophage region ( ; ×10
−2
), and the total count of pixels representing the particles in
the control region ( , ×10
−2
). The inset shows the decreasing average size of particles in the
control region over time (
,
in pixels).


Search WWH ::

Custom Search